
The Cronjob Conundrum
Instrumenting Cronjobs with Odigos: Part of the Blind Spot Series
Blind Spot Series: The CronJob Conundrum
What are Kubernetes Cronjobs, and Why do They Matter?
Kubernetes CronJobs let you schedule recurring tasks such as backups, batch processing, or data syncs. They are basically the “set-it-and-forget-it” automation layer of modern Kubernetes infrastructure. They run containers on a time-based schedule making them essential for repetitive quick tasks or relaying data or messages from many different services.
Despite their simplicity, CronJobs are critical to the reliability and performance of many systems. When CronJobs fail, it can lead to silent data loss, corrupted downstream services, or even missed SLAs.
The Conundrum...
Instrumentation of CronJobs can be challenging due to their architecture and the nature of their workload. Their ephemeral runtime often concludes before observability pipelines can capture telemetry, leading to gaps in logs, metrics, and traces. Without persistent processes or continuously active endpoints, there is no stable instrumentation point like there are in long-running services. For example, the absence of ingress traffic paths, like API gateways or load balancers, eliminates common hook points for request-level tracing. CronJobs are often started by the Kubernetes scheduler or internal orchestrators, not an HTTP request.
CronJobs frequently operate in isolated systems that bypass the observability layer, meaning they remain invisible unless explicit instrumentation is embedded. As a result, critical failures can occur without generating actionable telemetry, allowing silent errors to propagate undetected through distributed systems.
The absence of traceability for CronJobs can create significant operational risk. CronJobs often perform high-impact tasks such as database maintenance, API calls to upstream services, and automated infrastructure changes. Failures, especially partial or silent ones, can propagate downstream, creating subtle but severe systemic issues. Without distributed tracing and contextual telemetry, diagnosing these incidents is time consuming and difficult, and yet another blind spot in teams observability stacks.
Why you Should Instrument Cronjobs
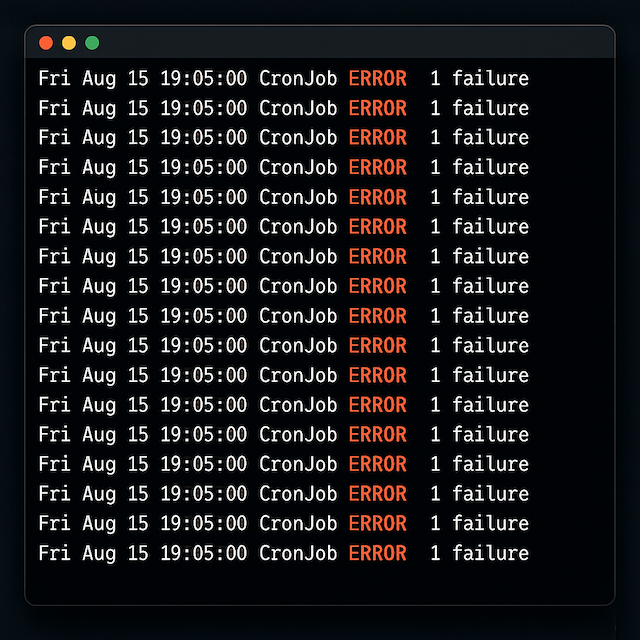
When CronJobs fail or silently misbehave, the consequences can be significant and debugging them is notoriously painful. Teams need to sift through short-lived pod logs, if they’re still available, and piece together what happened with minimal context.
Instrumenting CronJobs changes that. It allows teams to capture full trace context, showing what services a job interacted with, how long each step took, and where any errors occurred. Instead of flying blind, you gain clear, end-to-end insight into application behavior. This enables faster debugging, better alerting, and tighter integration into your overall observability strategy.
CronJobs might be infrequent and brief, but they play critical roles in most production environments. They deserve the same level of visibility as any always-on service.
Solving the Blind Spot with Odigos
Odigos makes it simple to bring visibility to these hidden Kubernetes workloads by automatically injecting OpenTelemetry instrumentation into your CronJobs. There's no need to modify the code, add sidecars, or manually configure collectors. Simply select the workload in the UI (or create a source cr) and Odigos does the rest.
Let’s walk through an example…
A Real Example: Tracing a Kubernetes CronJob with Odigos
I created a simple CronJob written in Python that fires every minute and makes a POST request with a randomized product ID to the frontend endpoint of my e-commerce app. Effectively I just wrapped the curl command below into a python app.
curl -X POST http://localhost:8080/buy?id=1
After writing the script, I containerized it with Docker and pushed the image to Docker Hub. From there, I deployed it to my Kubernetes cluster as a CronJob and configured it to run every minute.
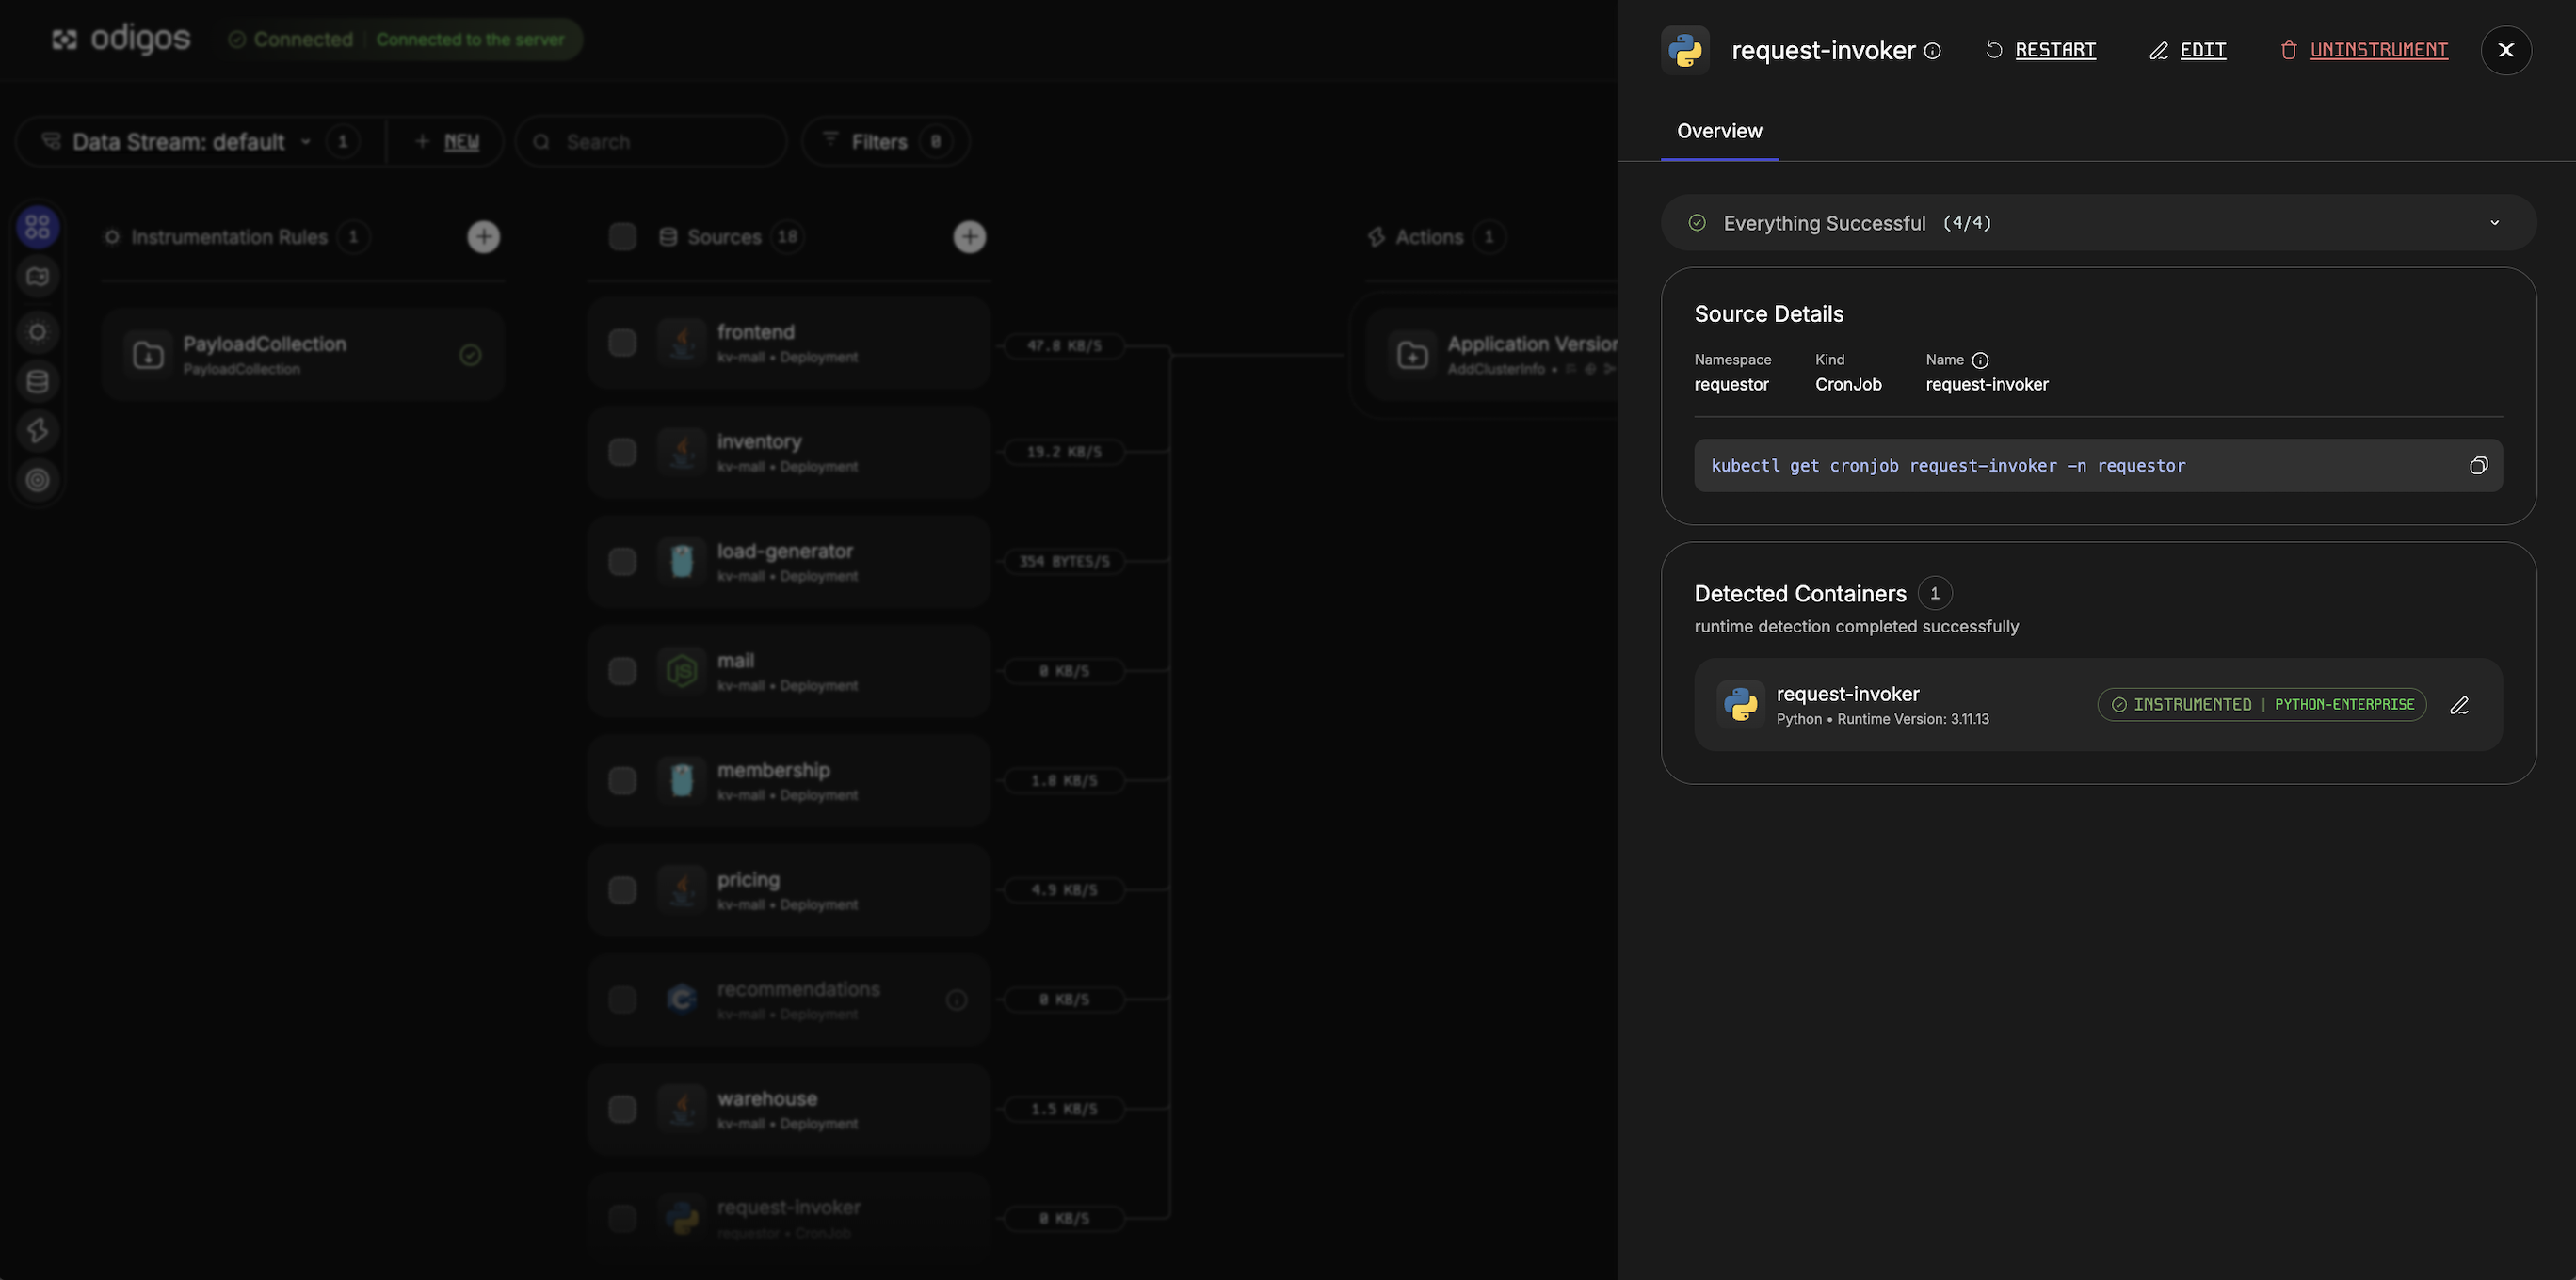
Once it was active in my environment, I instrumented it with Odigos. Odigos automatically discovered the new workload in my namespace, and all I needed to do was select it for instrumentation in the UI. Odigos took care of the rest. In seconds my CronJob was instrumented using eBPF and zero-code changes were made. The next time it ran, I saw a complete end-to-end trace starting from the Cronjob.
What the Trace Revealed
Using Jaeger, I could observe the full transaction starting with the CronJob. When it started, what product ID was requested, how long the backend took to respond, and whether the response was successful. If there had been a timeout or error, that would have been immediately visible in the trace.
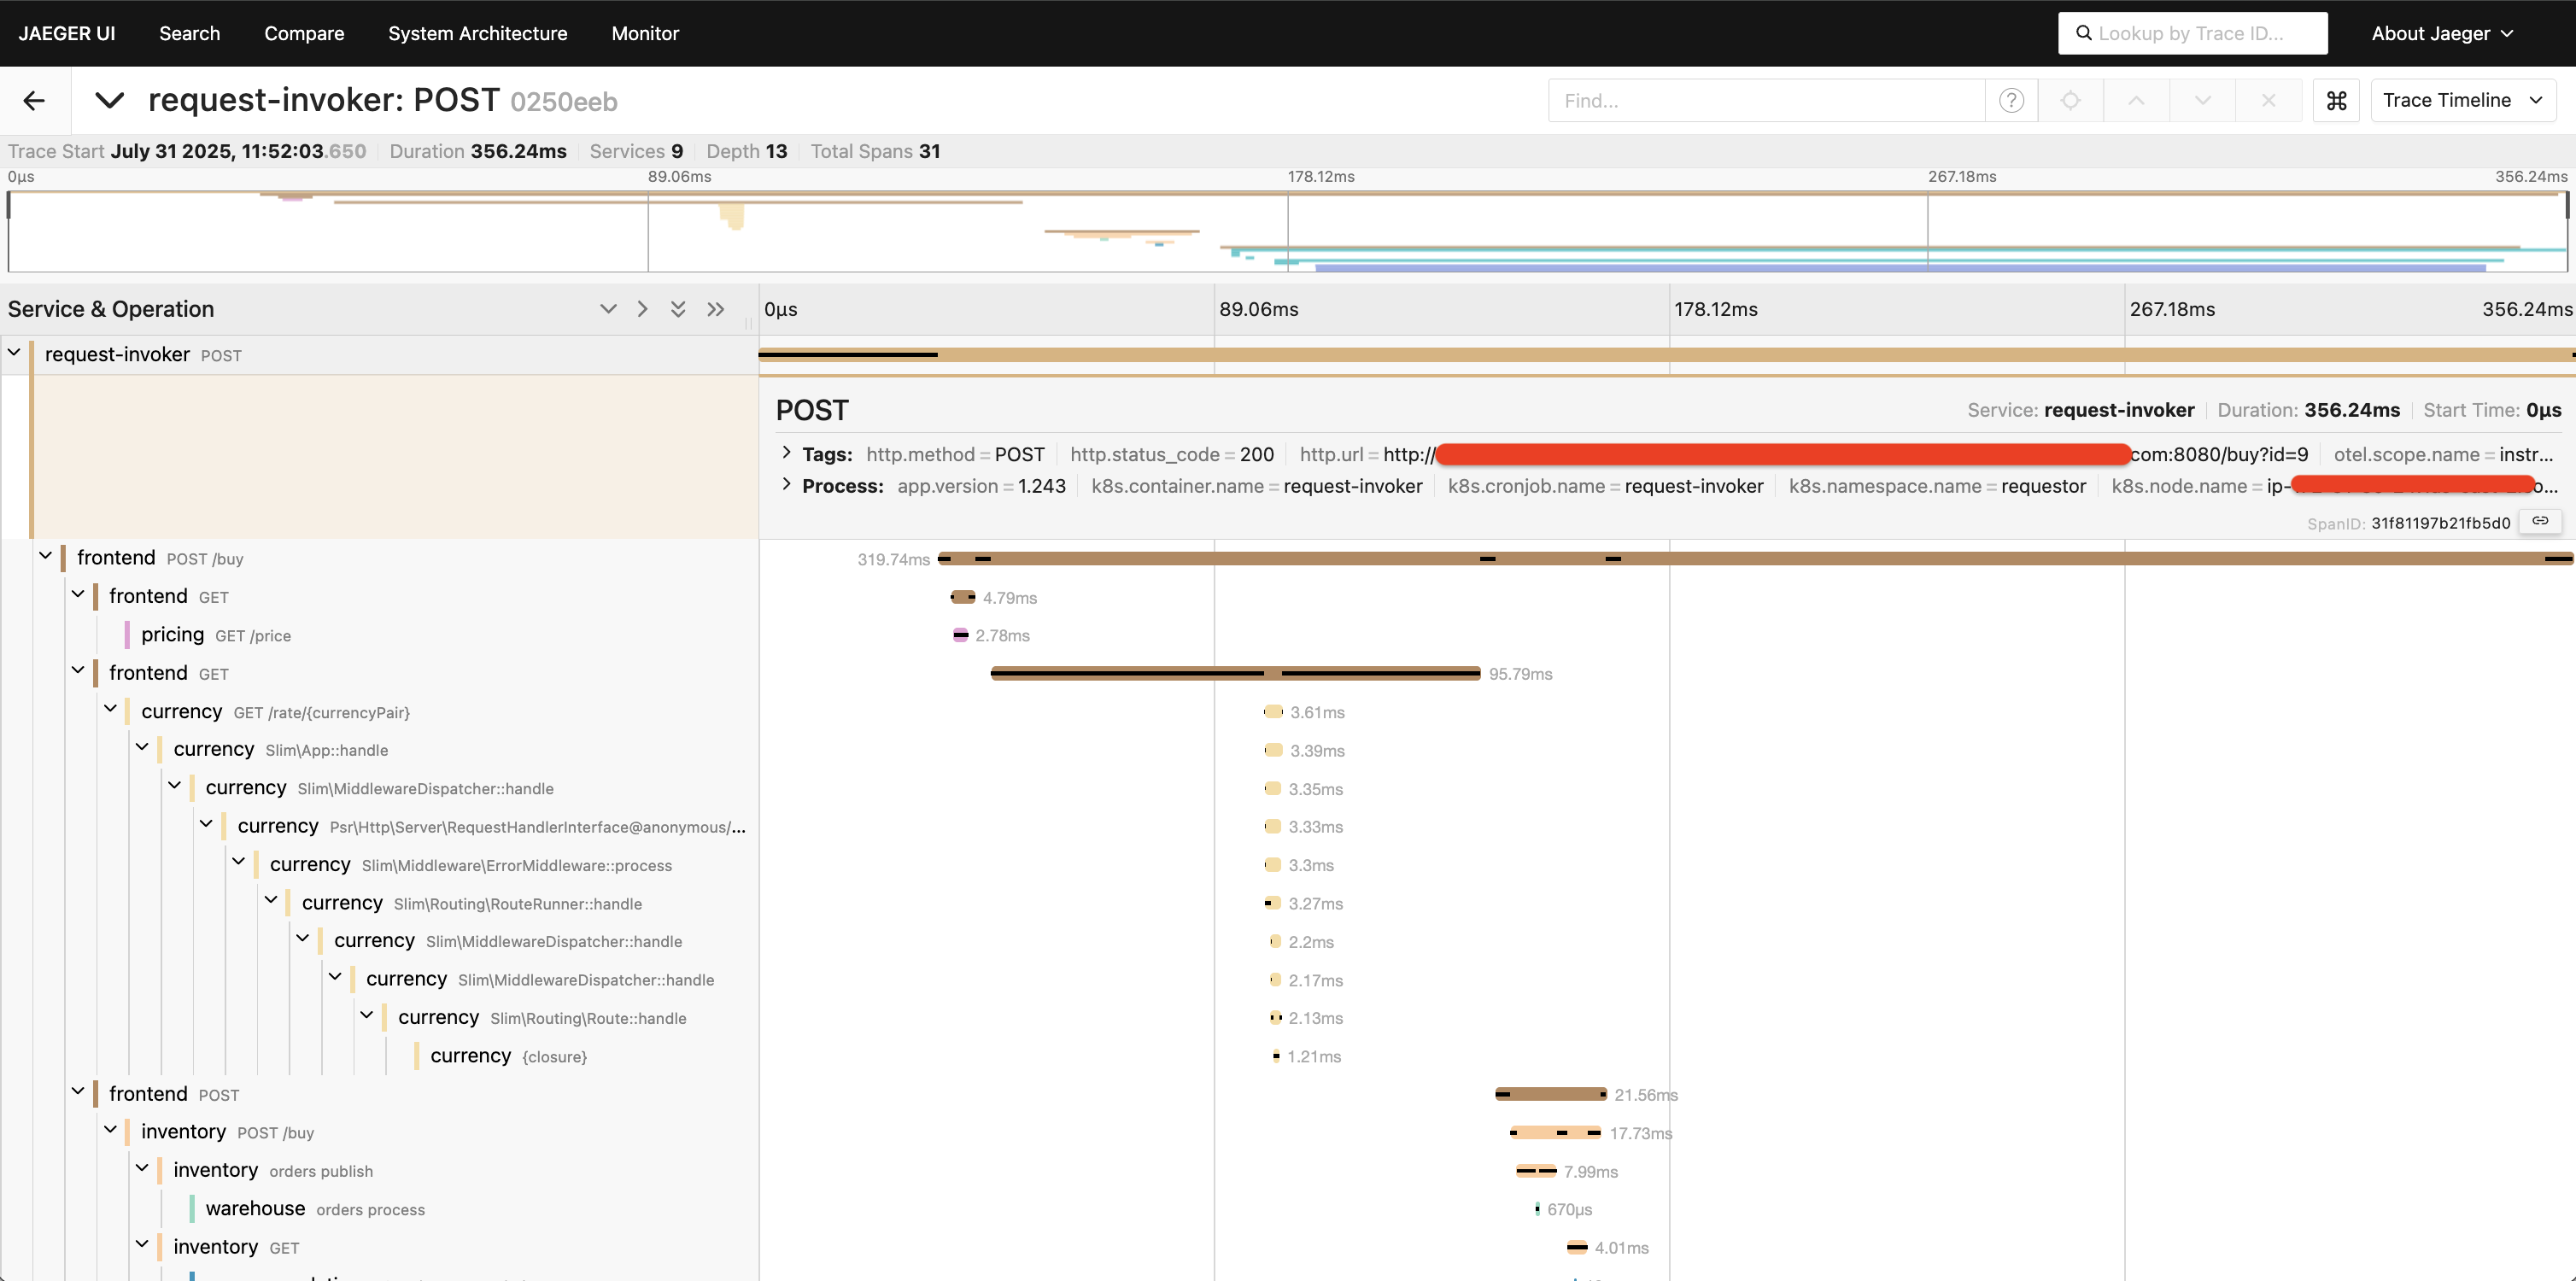
This kind of insight is impossible to obtain through logs alone, especially for short-lived jobs. With tracing, we knew the job ran successfully, and we knew exactly what it did.
Key Takeaways
CronJobs are easy to ignore in an observability strategy, but they often perform critical functions. The consequences of failures (especially silent ones) can be widespread. By instrumenting these jobs, teams can ensure that scheduled workloads are visible, debuggable, and accountable.
Odigos makes this process effortless. By injecting telemetry automatically, it promotes a unified observability story across all workloads ensure no spans are left behind and zero blind spots.
More from the blog.



Stop guessing. Ask production.
One agent. One service. See how Odigos helps answer a production question.