
What's New in the Odigos VM Agent: Built-in Traces, Pipeline Health, Profiling and More
The Odigos VM Agent now ships with a built-in collector, a local trace viewer, live pipeline metrics, in-terminal CPU profiling, an events panel and new data-shaping actions.
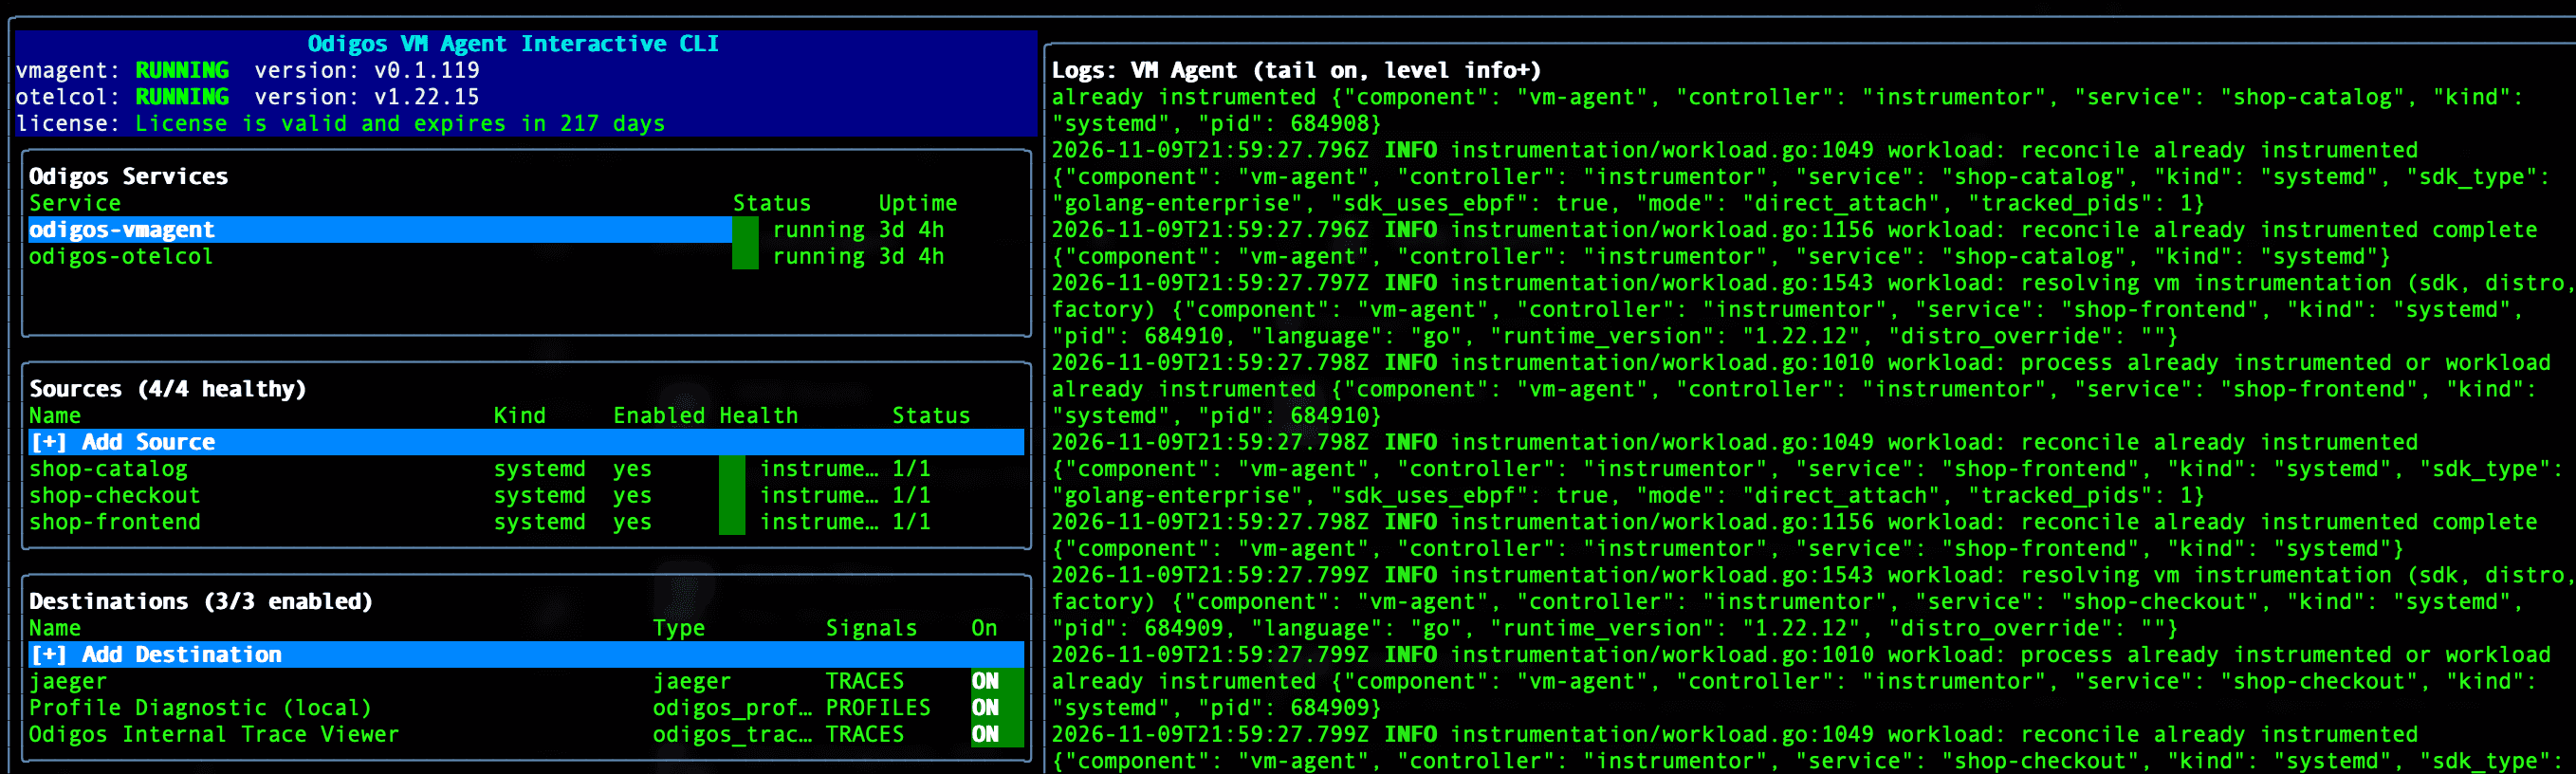
Kubernetes gets most of the attention in observability, but a lot of critical software still runs on plain Linux VMs and bare metal: systemd services, Docker hosts, legacy apps and vendor binaries nobody wants to touch. The Odigos VM Agent brings zero-code OpenTelemetry instrumentation to those machines, and the latest releases add a set of features aimed at the people who operate them.
The common thread is simple: you should be able to answer "is it working?" from the box itself. Is the agent healthy? Are traces being produced? Are they actually reaching my backend? Where is the service spending its CPU time? All of that is now available in odictl, the VM Agent's interactive terminal UI, without opening another tool.
Here's what's new.
One install, collector included
Previously, a VM install meant setting up and running two things: the agent and a separate OpenTelemetry Collector service. The collector is now built into the VM Agent. Install the odigos package and the agent brings its own collector and runs it for you. There's no separate collector service to enable, configure or keep in sync.
That means:
- Simpler installs. One
sudo dnf install odigosorsudo apt install odigos, and one systemd service (odigos-vmagent) to manage. - No version drift. The agent and its collector ship and upgrade together.
- Fewer moving parts for teams with strict change control on production VMs.
Trace Viewer: see traces without a backend
You should be able to view and analyze your traces at a glance, without having to rely on another tool to visualize your own telemetry data. Whether you're validating a fresh install, checking a new instrumentation rule or troubleshooting a box that can't reach your central backend, the answer should be one keystroke away.
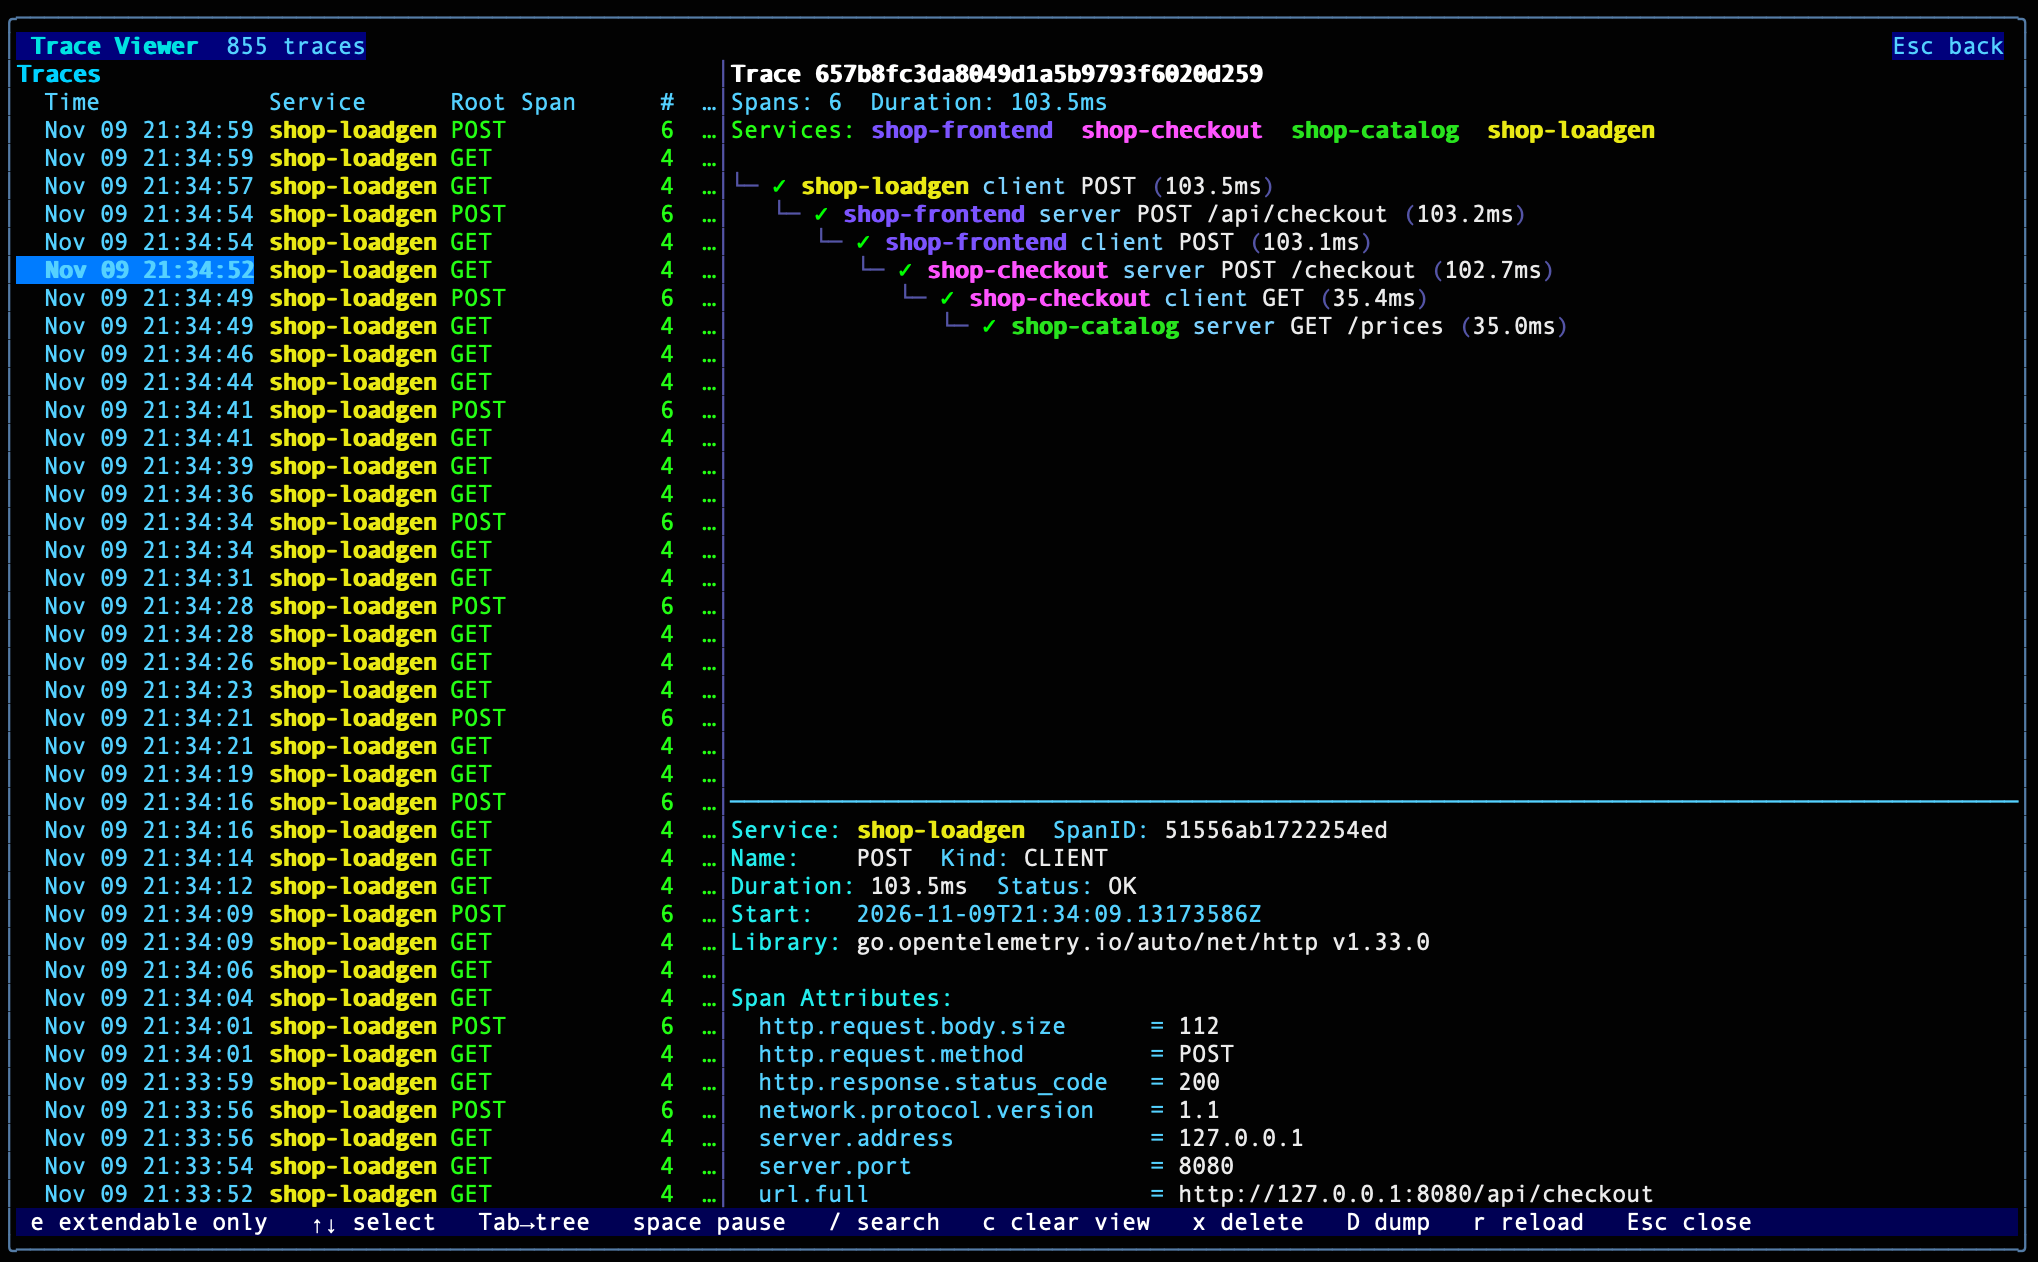
The Odigos Internal Trace Viewer captures a local copy of collected traces to a file on the agent, so you can browse recent traces right in odictl. No external backend is required.
- Press
Tto open the Trace Viewer for all traces, or select a source and presstto see only that service's traces. - The trace list shows each trace's time, service, root span, span count and duration. New traces stream in live; press space to pause.
- Select a trace to see its full span tree across services, then select a span to see its attributes. Use
/to search. - Storage is bounded (50 MB by default) and stays on the VM.
Turning it on takes one keystroke: open the viewer and press Enter, or set it in the agent config:
data_collection:
  trace_viewer:
    enabled: true
Pipeline metrics: is my data actually getting there?
Traces being produced and traces arriving at your backend are two different things. A wrong endpoint, an expired API key or a backend under pressure can silently drop data.
Press M in odictl for live pipeline metrics. For every destination, you get the number of items sent, queued and failed for each signal: traces, metrics, logs and profiles. A summary row totals everything, and the header shows whether the collector is healthy.
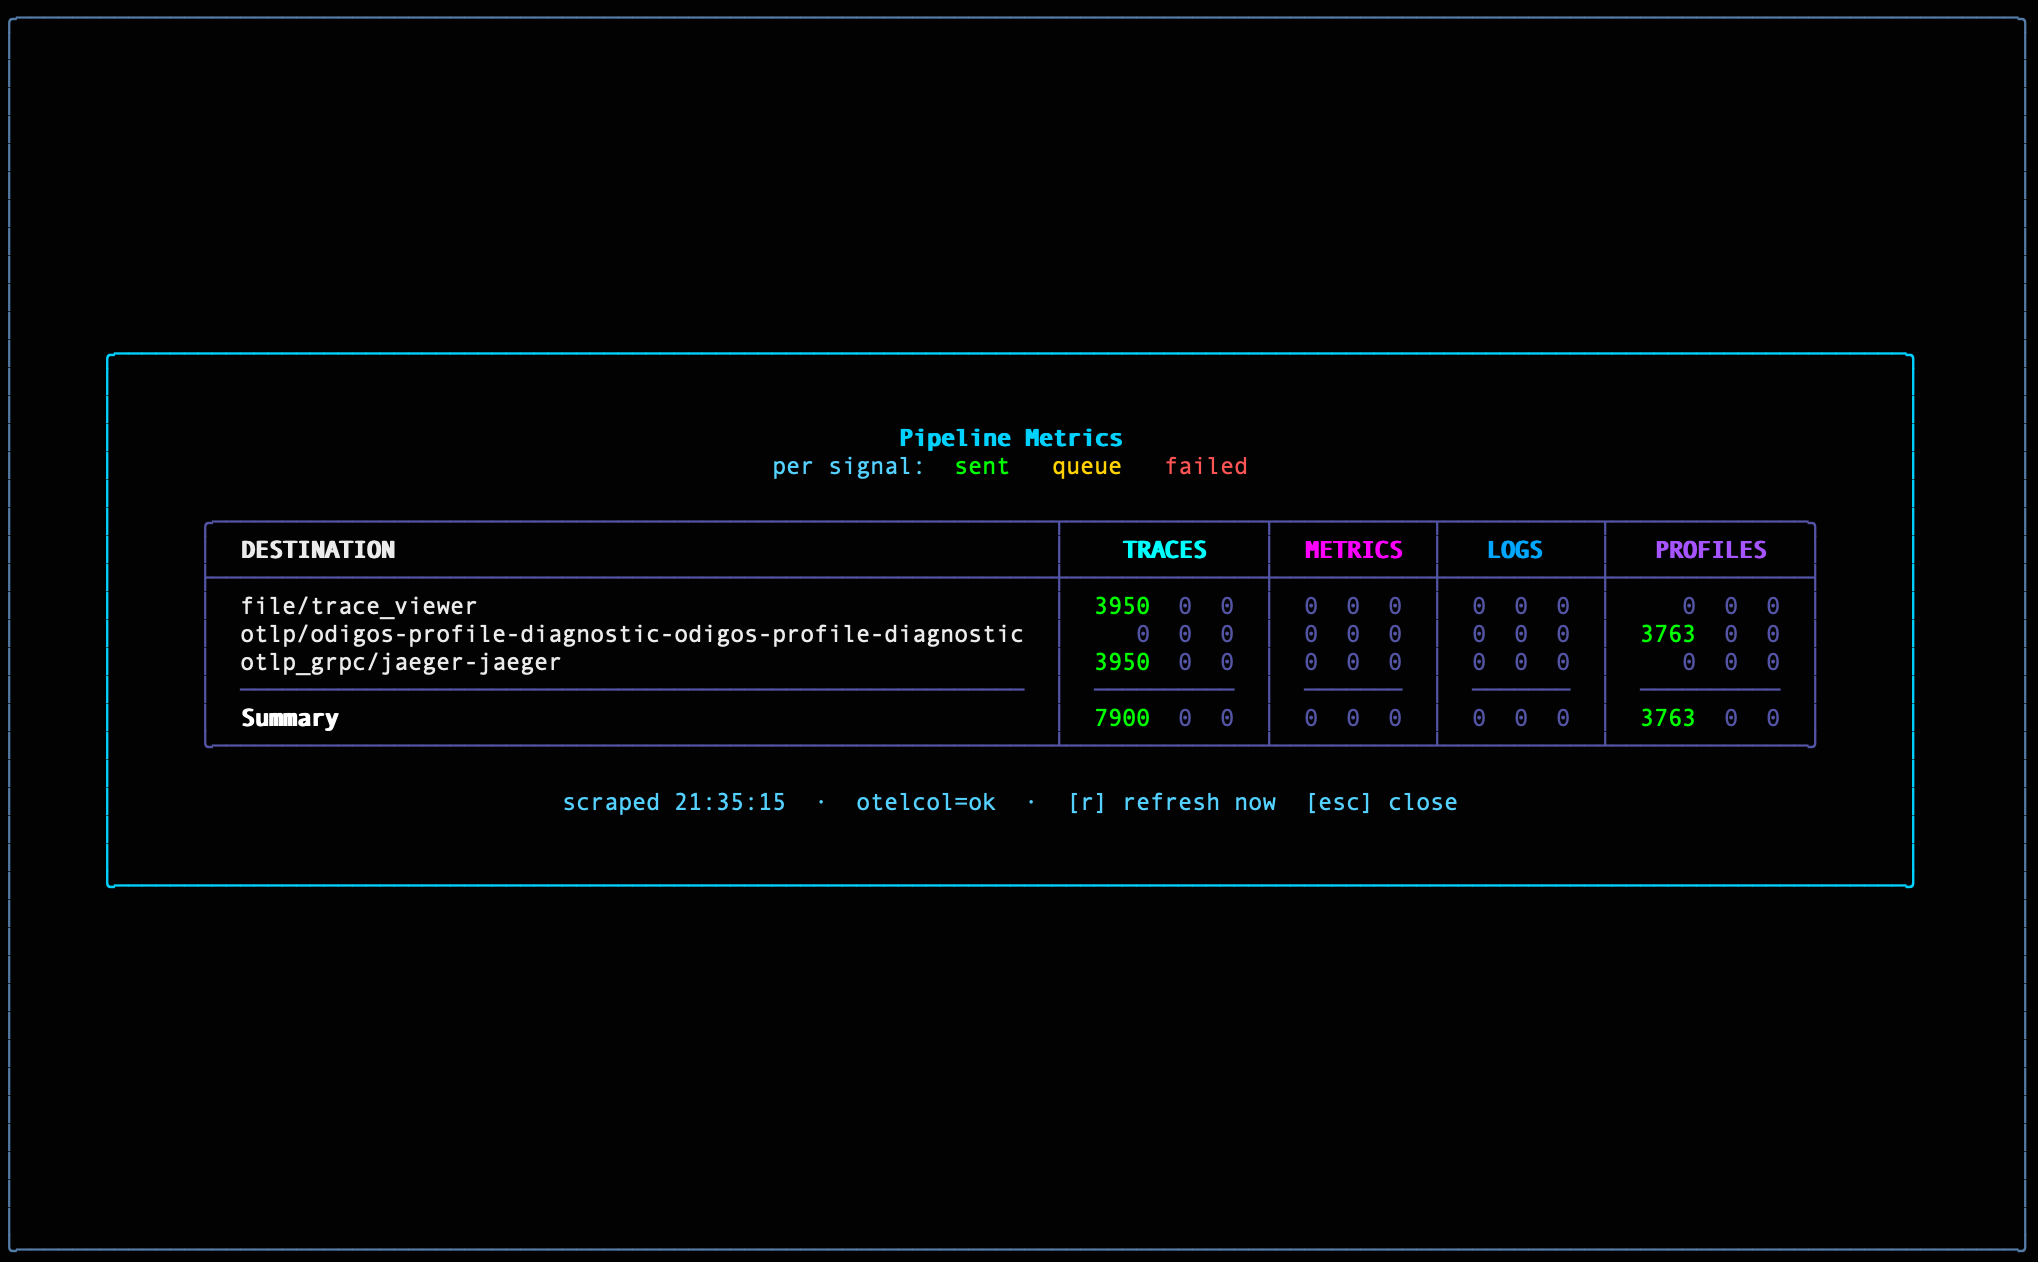
In this example, the same traces fan out to two destinations, Jaeger and the local Trace Viewer, with identical sent counts and zero queued or failed, while profiles flow to a separate profiling destination. When something does go wrong, a growing queue or failed count points you at the exact destination and signal, before anyone notices a gap in a dashboard.
Hot functions: CPU profiling in the terminal
Traces tell you a request was slow. Profiles tell you where the CPU time went. The VM Agent runs continuous CPU profiling with the OpenTelemetry eBPF Profiler, with no code changes, and odictl now has a built-in profiling view, so you don't need a separate profiling backend to use it.
Press P to open the view. If profiling isn't on yet, odictl offers to enable it, and samples start appearing within about a minute.
- The Services pane lists every source with profile data.
- The Functions pane ranks the hottest functions for the selected service by self and total CPU time.
- The Filter modules bar narrows the list to app, library or kernel code. Press
afor app-only functions.
From the hot function list, press i on any function to add custom instrumentation for it. The function then shows up as its own span in your traces, without touching the code. Profiling shows you where the time goes, and one keystroke turns that function into a span you can follow.
For long-term retention and flame graphs, profiles can also be exported over OTLP to a profiles-compatible destination such as Pyroscope.
New actions: shape your data before it leaves the VM
Actions let you transform telemetry in the agent's pipeline before it reaches any destination. That means sensitive data never leaves the box, and every backend receives clean, consistent data. This release adds several new action types, each with a commented template in odictl (press a, then Add Action).
PII masking
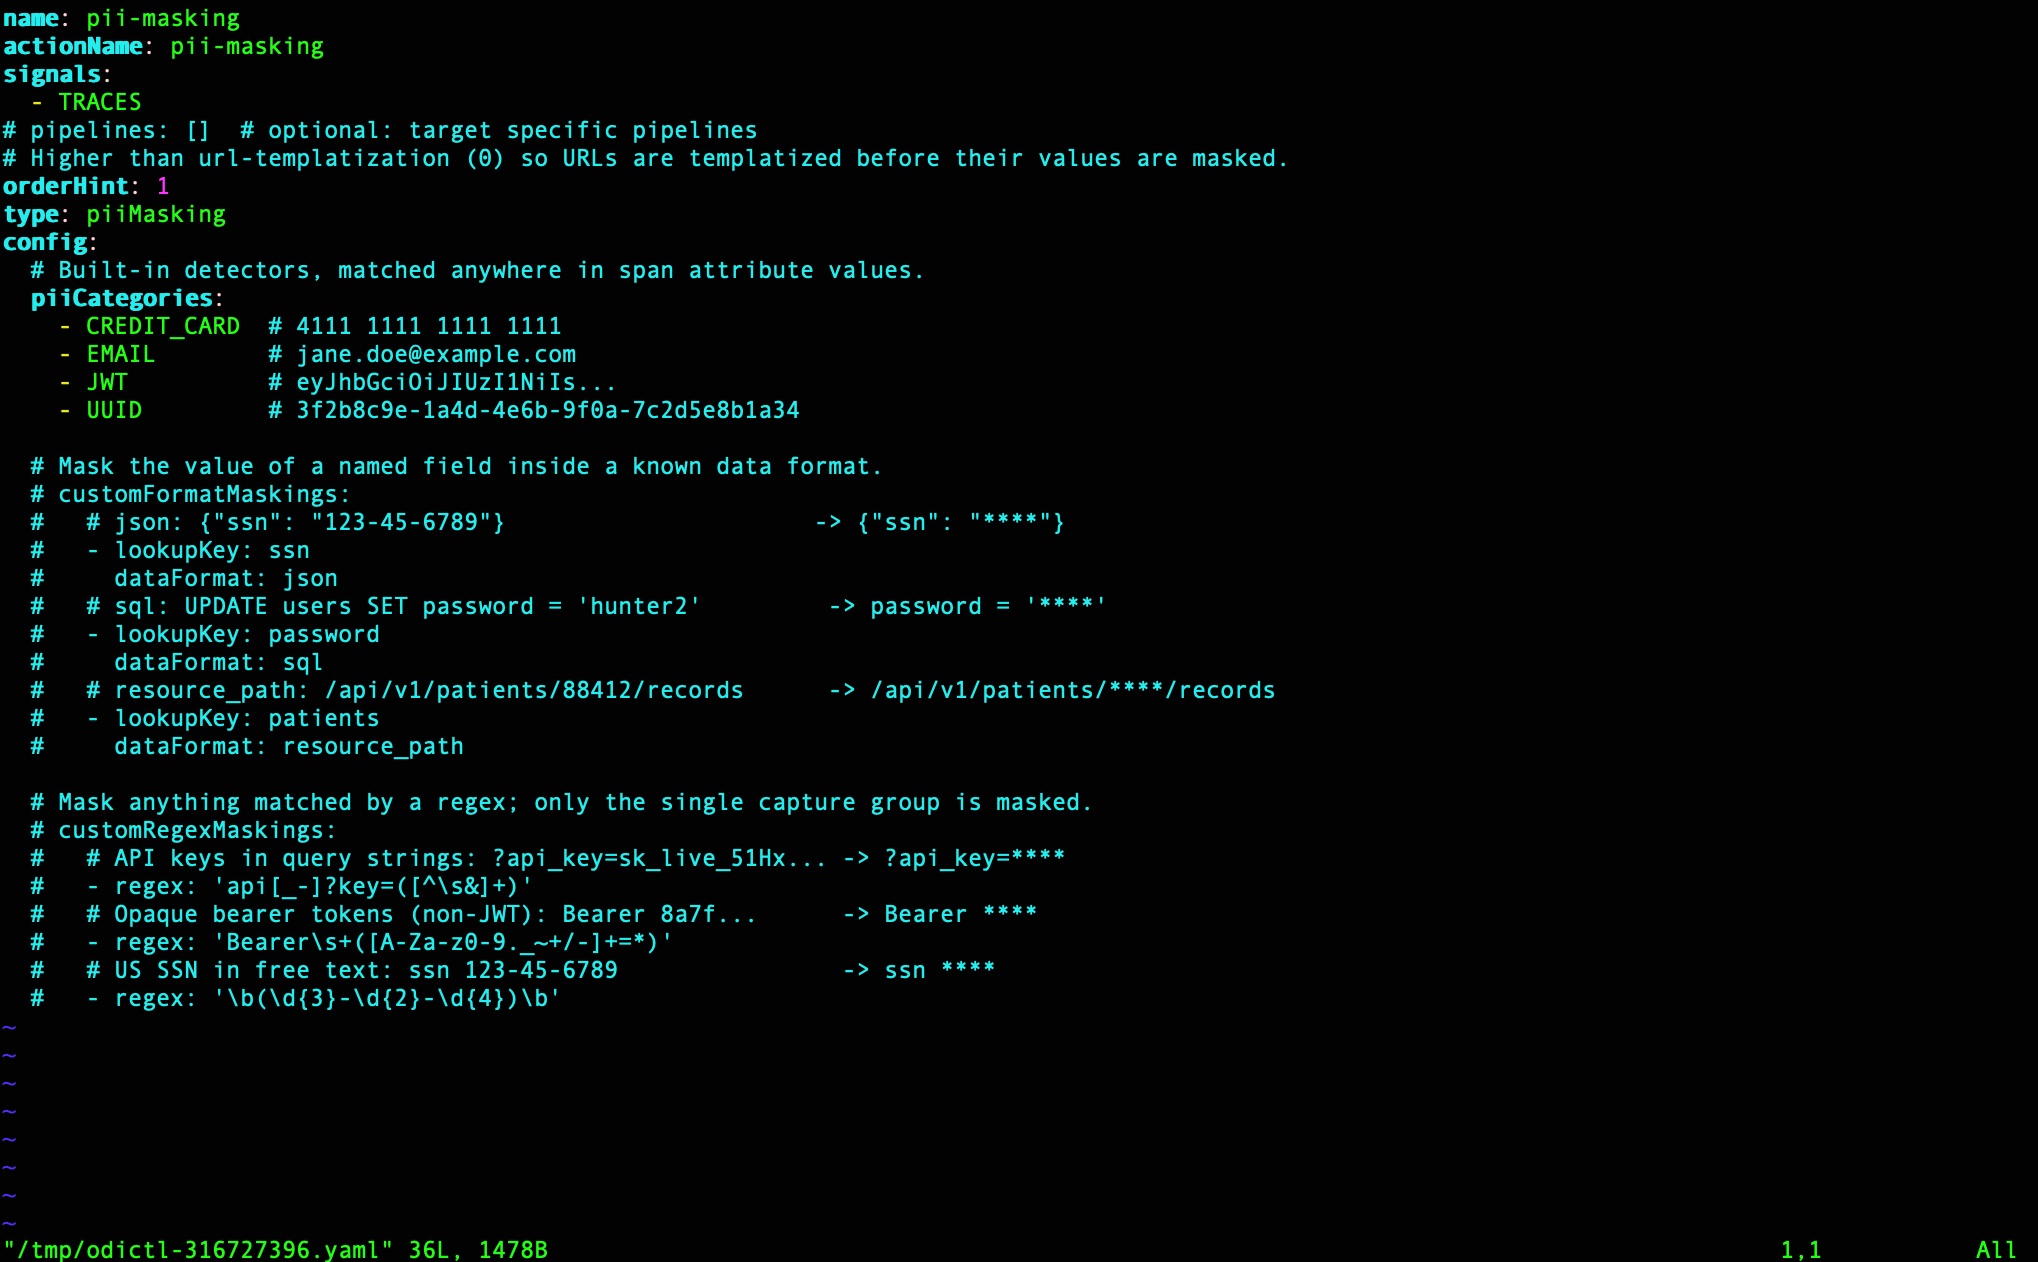
The PII masking action redacts sensitive values in span attributes. It includes built-in detectors for credit card numbers, email addresses, JWTs and UUIDs, plus two ways to define your own:
name: pii-masking
type: piiMasking
signals:
  - TRACES
config:
  piiCategories:
    - CREDIT_CARD  # 4111 1111 1111 1111
    - EMAIL        # jane.doe@example.com
    - JWT          # eyJhbGciOiJIUzI1NiIs...
  # Mask the value of a named field inside JSON, SQL or a URL path
  customFormatMaskings:
    - lookupKey: ssn
      dataFormat: json      # {"ssn": "123-45-6789"} -> {"ssn": "****"}
    - lookupKey: password
      dataFormat: sql       # SET password = 'hunter2' -> password = '****'
  # Mask anything matched by a regex capture group
  customRegexMaskings:
    - regex: 'api[_-]?key=([^\s&]+)'   # ?api_key=sk_live_51Hx... -> ?api_key=****
Values matched by a built-in category are replaced with a labeled token such as ***EMAIL*** or ***CREDIT_CARD***, so you can still see what kind of data was there. Custom maskings replace only the matched value with **** and leave the rest of the attribute intact. PII masking runs after URL templatization, so URL paths are normalized first and then masked.
DB query templatization
Raw SQL in spans is noisy and risky: every WHERE id = 1, id = 2 and id = 3 becomes a separate value, and literals can contain customer data. DB query templatization replaces literals with placeholders:
type: dbQueryTemplatization
config:
  templatizeLiterals: true           # SELECT * FROM users WHERE id = 1 -> ... WHERE id = ?
  removePostgresCastOperator: true   # ... WHERE id = ?::uuid -> ... WHERE id = ?
The action rewrites the query text on the span in place. Number and string literals become ?, while table and column names, bind parameters, booleans and NULL are left alone. Non-SQL systems like MongoDB and Redis are skipped.
The result is low-cardinality queries you can group, aggregate and alert on, and literal values like emails or IDs inlined into SQL never reach your backend. It works with a Payload Collection rule that captures DB query text. A companion infer DB attributes action can then add db.operation.name and db.collection.name parsed from the query.
Extract attribute
Some of the most useful context lives inside payloads and SQL. Extract attribute scans a span's query and payload attributes (db.query.text, http.request.payload, http.response.payload, messaging.message.payload and similar), and copies a matched value into its own span attribute so you can search and filter on it:
type: extractAttribute
config:
  extractions:
    - targetAttributeName: customerId
      lookupKey: customer_id
      dataFormat: json             # {"customer_id": "c-1234"} -> customerId=c-1234
    - targetAttributeName: invoiceId
      lookupKey: invoice_id
      dataFormat: sql              # SELECT * FROM invoices WHERE invoice_id = 77 -> invoiceId=77
    - targetAttributeName: orderCode
      regex: 'order=([^&]+)'       # ?order=ORD-4821 -> orderCode=ORD-4821
Finding "every trace for customer c-1234" becomes a simple attribute query. It pairs well with the actions above: extract the one field you need, then delete or mask the full payload so it never leaves the VM.
Delete attribute
Delete attribute removes attributes you don't want stored, from resource, scope and record attributes across traces, metrics and logs:
type: deleteAttribute
signals: [TRACES, METRICS, LOGS]
config:
  attributeNamesToDelete:
    - user.email
    - http.request.header.authorization
Use it to drop sensitive fields outright or to cut storage costs from high-volume attributes nobody queries. A matching rename attribute action helps standardize names across services, for example db.statement to db.query.text.
Events panel: know when something goes wrong
Before, finding out why the agent wasn't doing what you expected meant digging through logs with journalctl. The new events panel collects recent changes, warnings and errors from the agent, the collector and the export pipeline in one place.
- An unread banner at the bottom of
odictlshows the latest problem as soon as it happens. - Press Ctrl+E to open the panel. Each event shows its time, level, source and message, and repeats are grouped with a count instead of flooding the list.
- Select an event to see its details, including when it was first and last seen. Press
wto show warnings only, ormto mark everything as read.
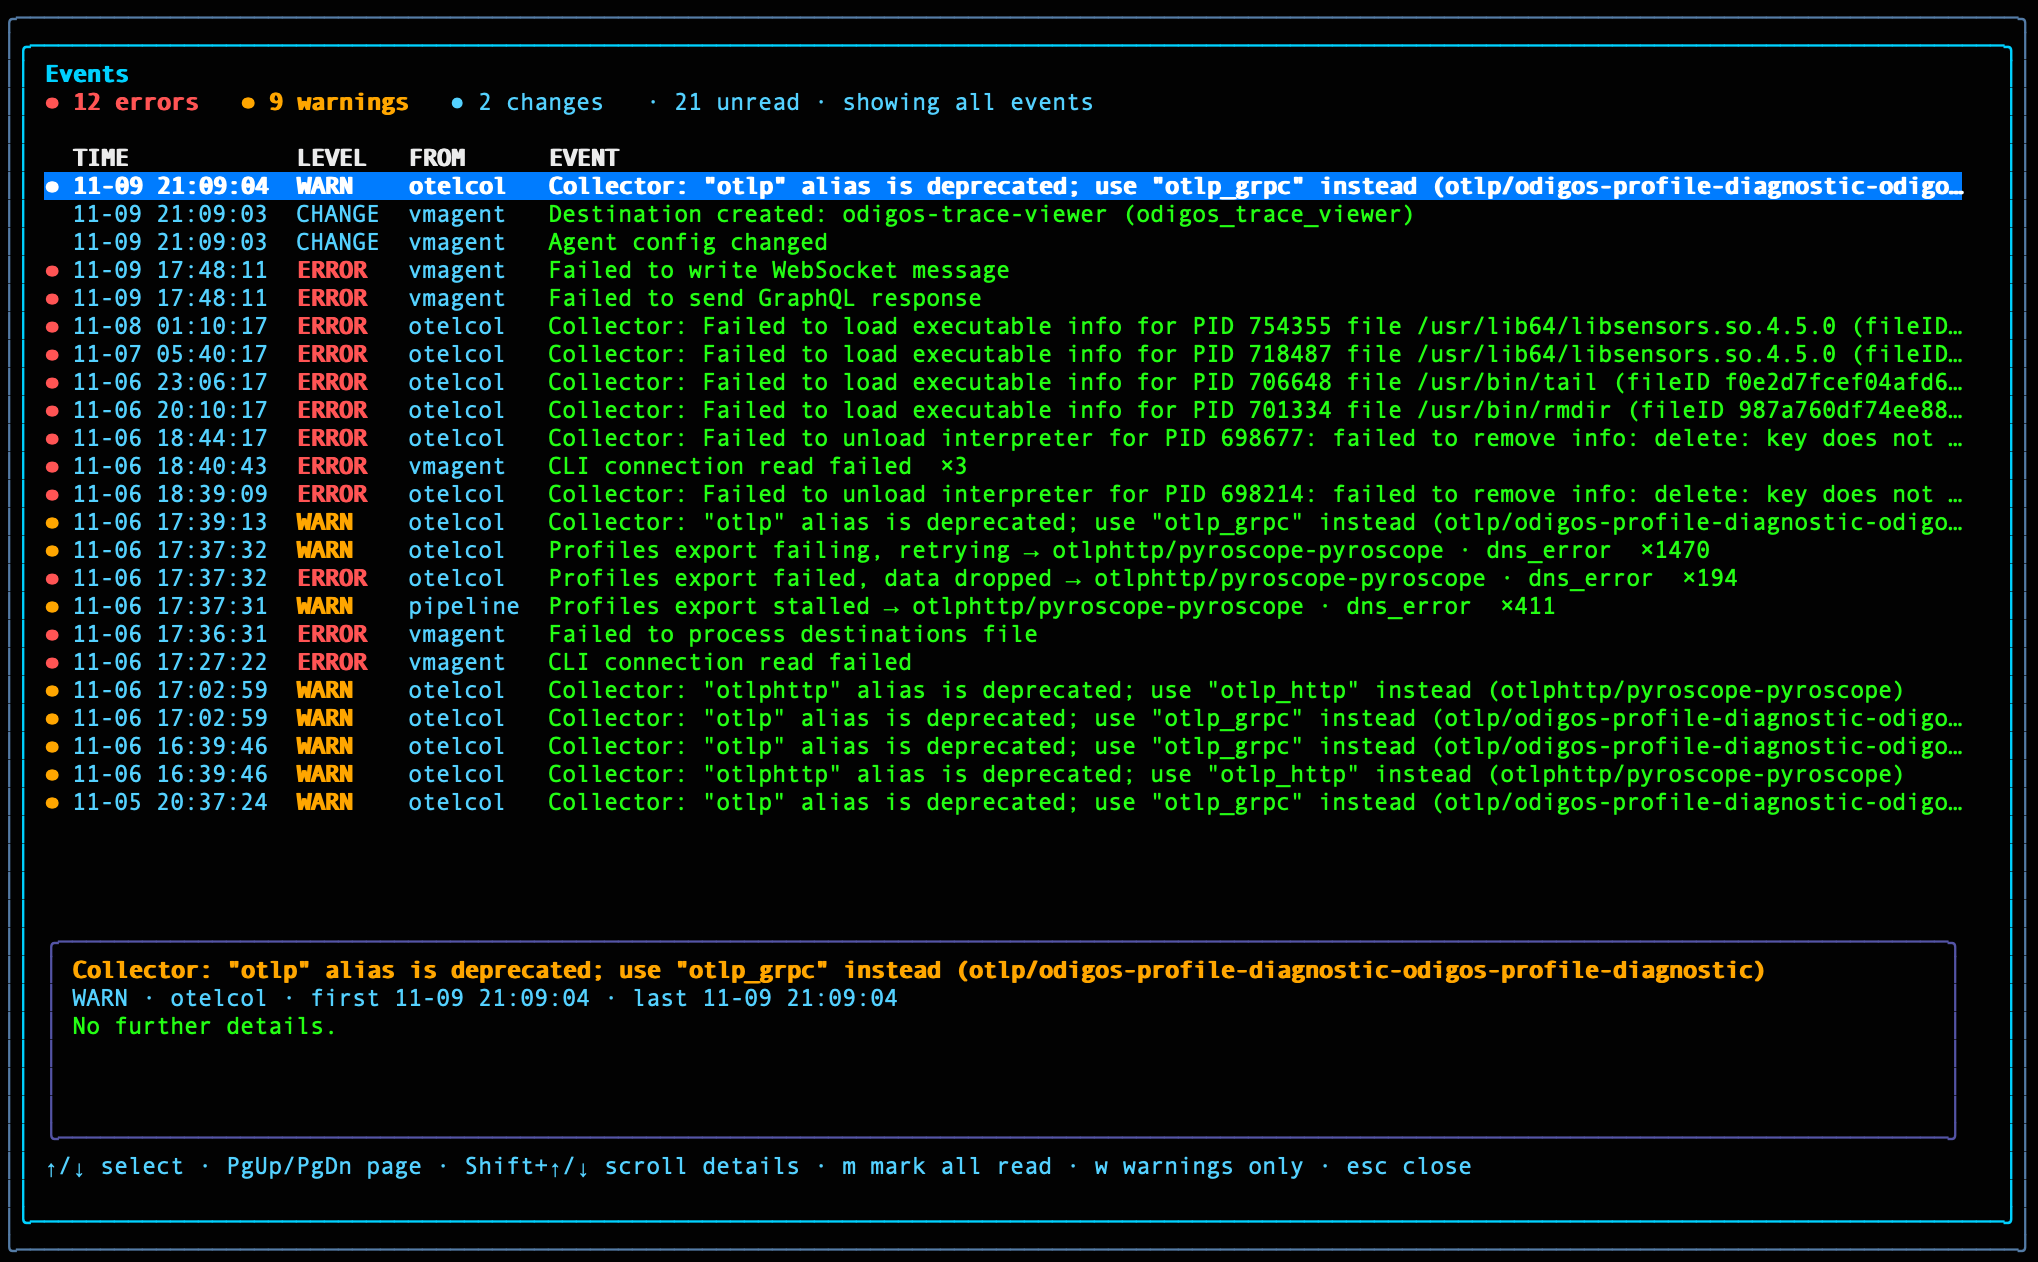
This saved us time on our own test VM. A profiles destination had a bad endpoint, and the panel showed it immediately: "Profiles export failing, retrying → otlphttp/pyroscope-pyroscope · dns_error ×1470", alongside a "Profiles export stalled" pipeline warning. The destination, the signal and the cause were all on one line, with no log searching needed. Config changes show up too: when we turned on the Trace Viewer, the panel recorded the new odigos-trace-viewer destination and the agent config change, so you can match a new problem to the change that caused it.
Getting started
If you already run the VM Agent, upgrade the package and open odictl. Every view above is a keystroke away (press ? for the full list):
| Key | View |
|---|---|
T / t | Trace Viewer (all traces / selected source) |
M | Live pipeline metrics |
P | Profiling: hot functions |
Ctrl+E | Events panel |
a | Actions |
New to the VM Agent? Getting traces from a VM takes a few minutes:
- Install the package with
sudo dnf install odigosorsudo apt install odigos. - Apply your license with
sudo odictl -odigos-license '<JWT>', then start the agent withsudo systemctl enable --now odigos-vmagent. - Run
odictl, add your services as Sources and add a destination, or skip the destination and start with the built-in Trace Viewer. - Generate some traffic and press
T.
Start with the VM Agent documentation, or get a demo.
More from the blog.
Stop guessing. Ask production.
One agent. One service. See how Odigos helps answer a production question.