
Serverless Without Blind Spots: Introducing Odigos Cloud Connectors
Discover and instrument AWS Lambda, Fargate, and Cloud Run from Odigos Central.

Odigos Central already manages observability across Kubernetes clusters and VMs. Cloud Connectors extend that control plane into your cloud accounts, so serverless workloads can be discovered and instrumented from the same UI.
The problem
Requests often leave the cluster and land in Lambda, Fargate, or Cloud Run. On Kubernetes, auto-instrumentation is straightforward. On serverless, teams still attach layers, inject sidecars, and manage environment variables per function or task. That does not scale, and traces usually break at the boundary.
What Cloud Connectors do
Cloud Connectors are the third connection type in Odigos Central, alongside remote clusters and the VM Agent.
Each connector maps to one cloud account boundary: an AWS account or a GCP project. From Central you can:
- Discover instrumentable workloads in that account
- Create Sources for the ones you want to observe
- Track instrumentation status as telemetry starts flowing
Nothing is instrumented until you create a Source. Discovery is inventory; Sources are intent.
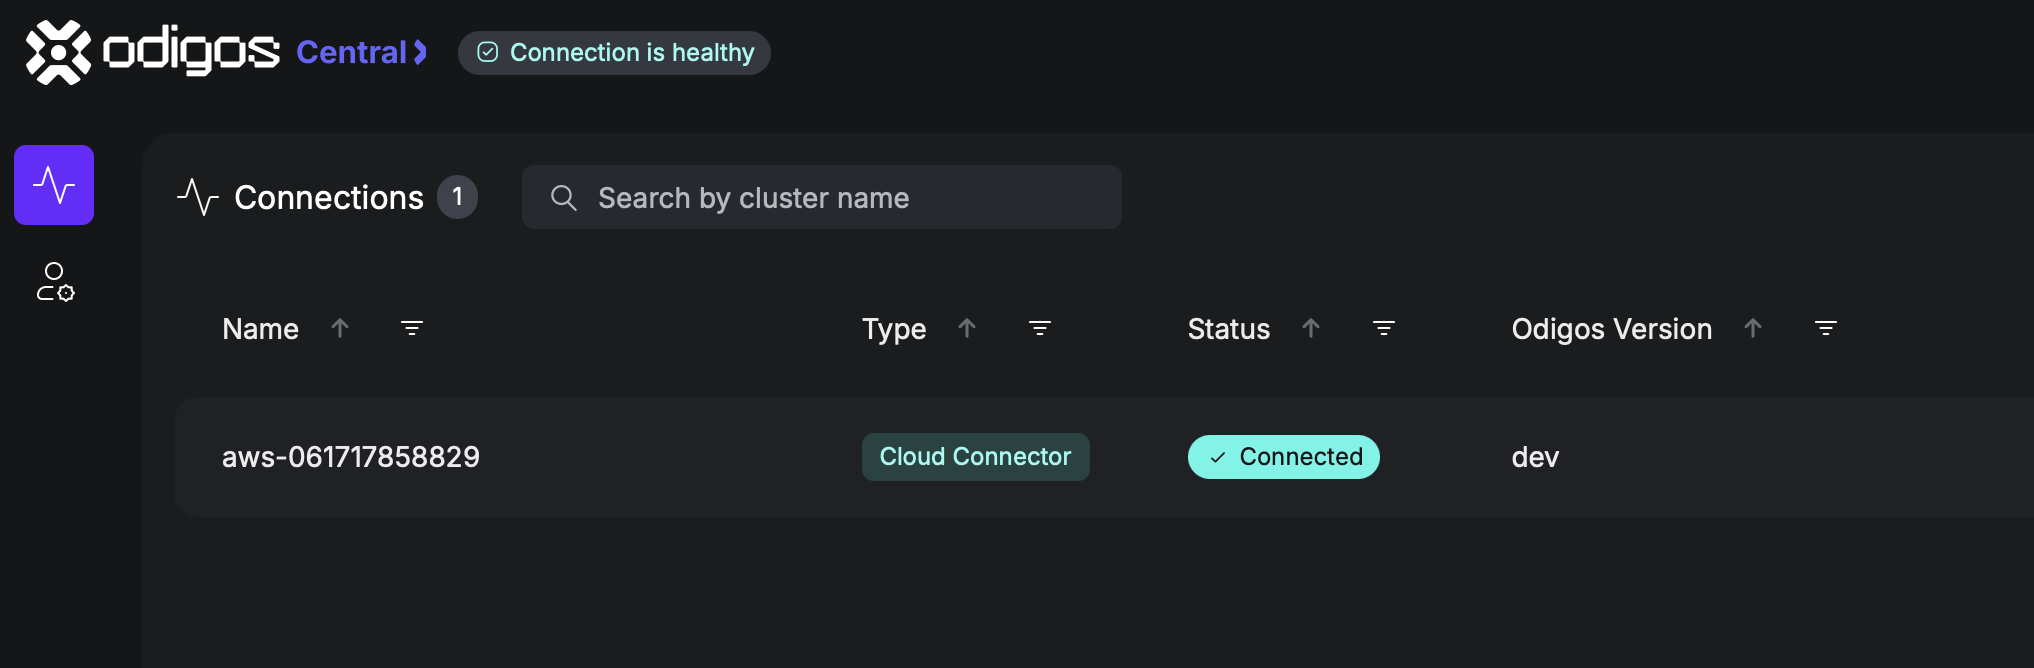
When a connector is online, it appears in the Central Connections view:
Access control
Cloud Connectors do not require blanket admin access. When you add a connector, you choose an access level:
- Discovery only - list workloads, no changes
- Discovery + instrumentation - discover and apply instrumentation
- Custom - choose which resource types can be discovered or instrumented
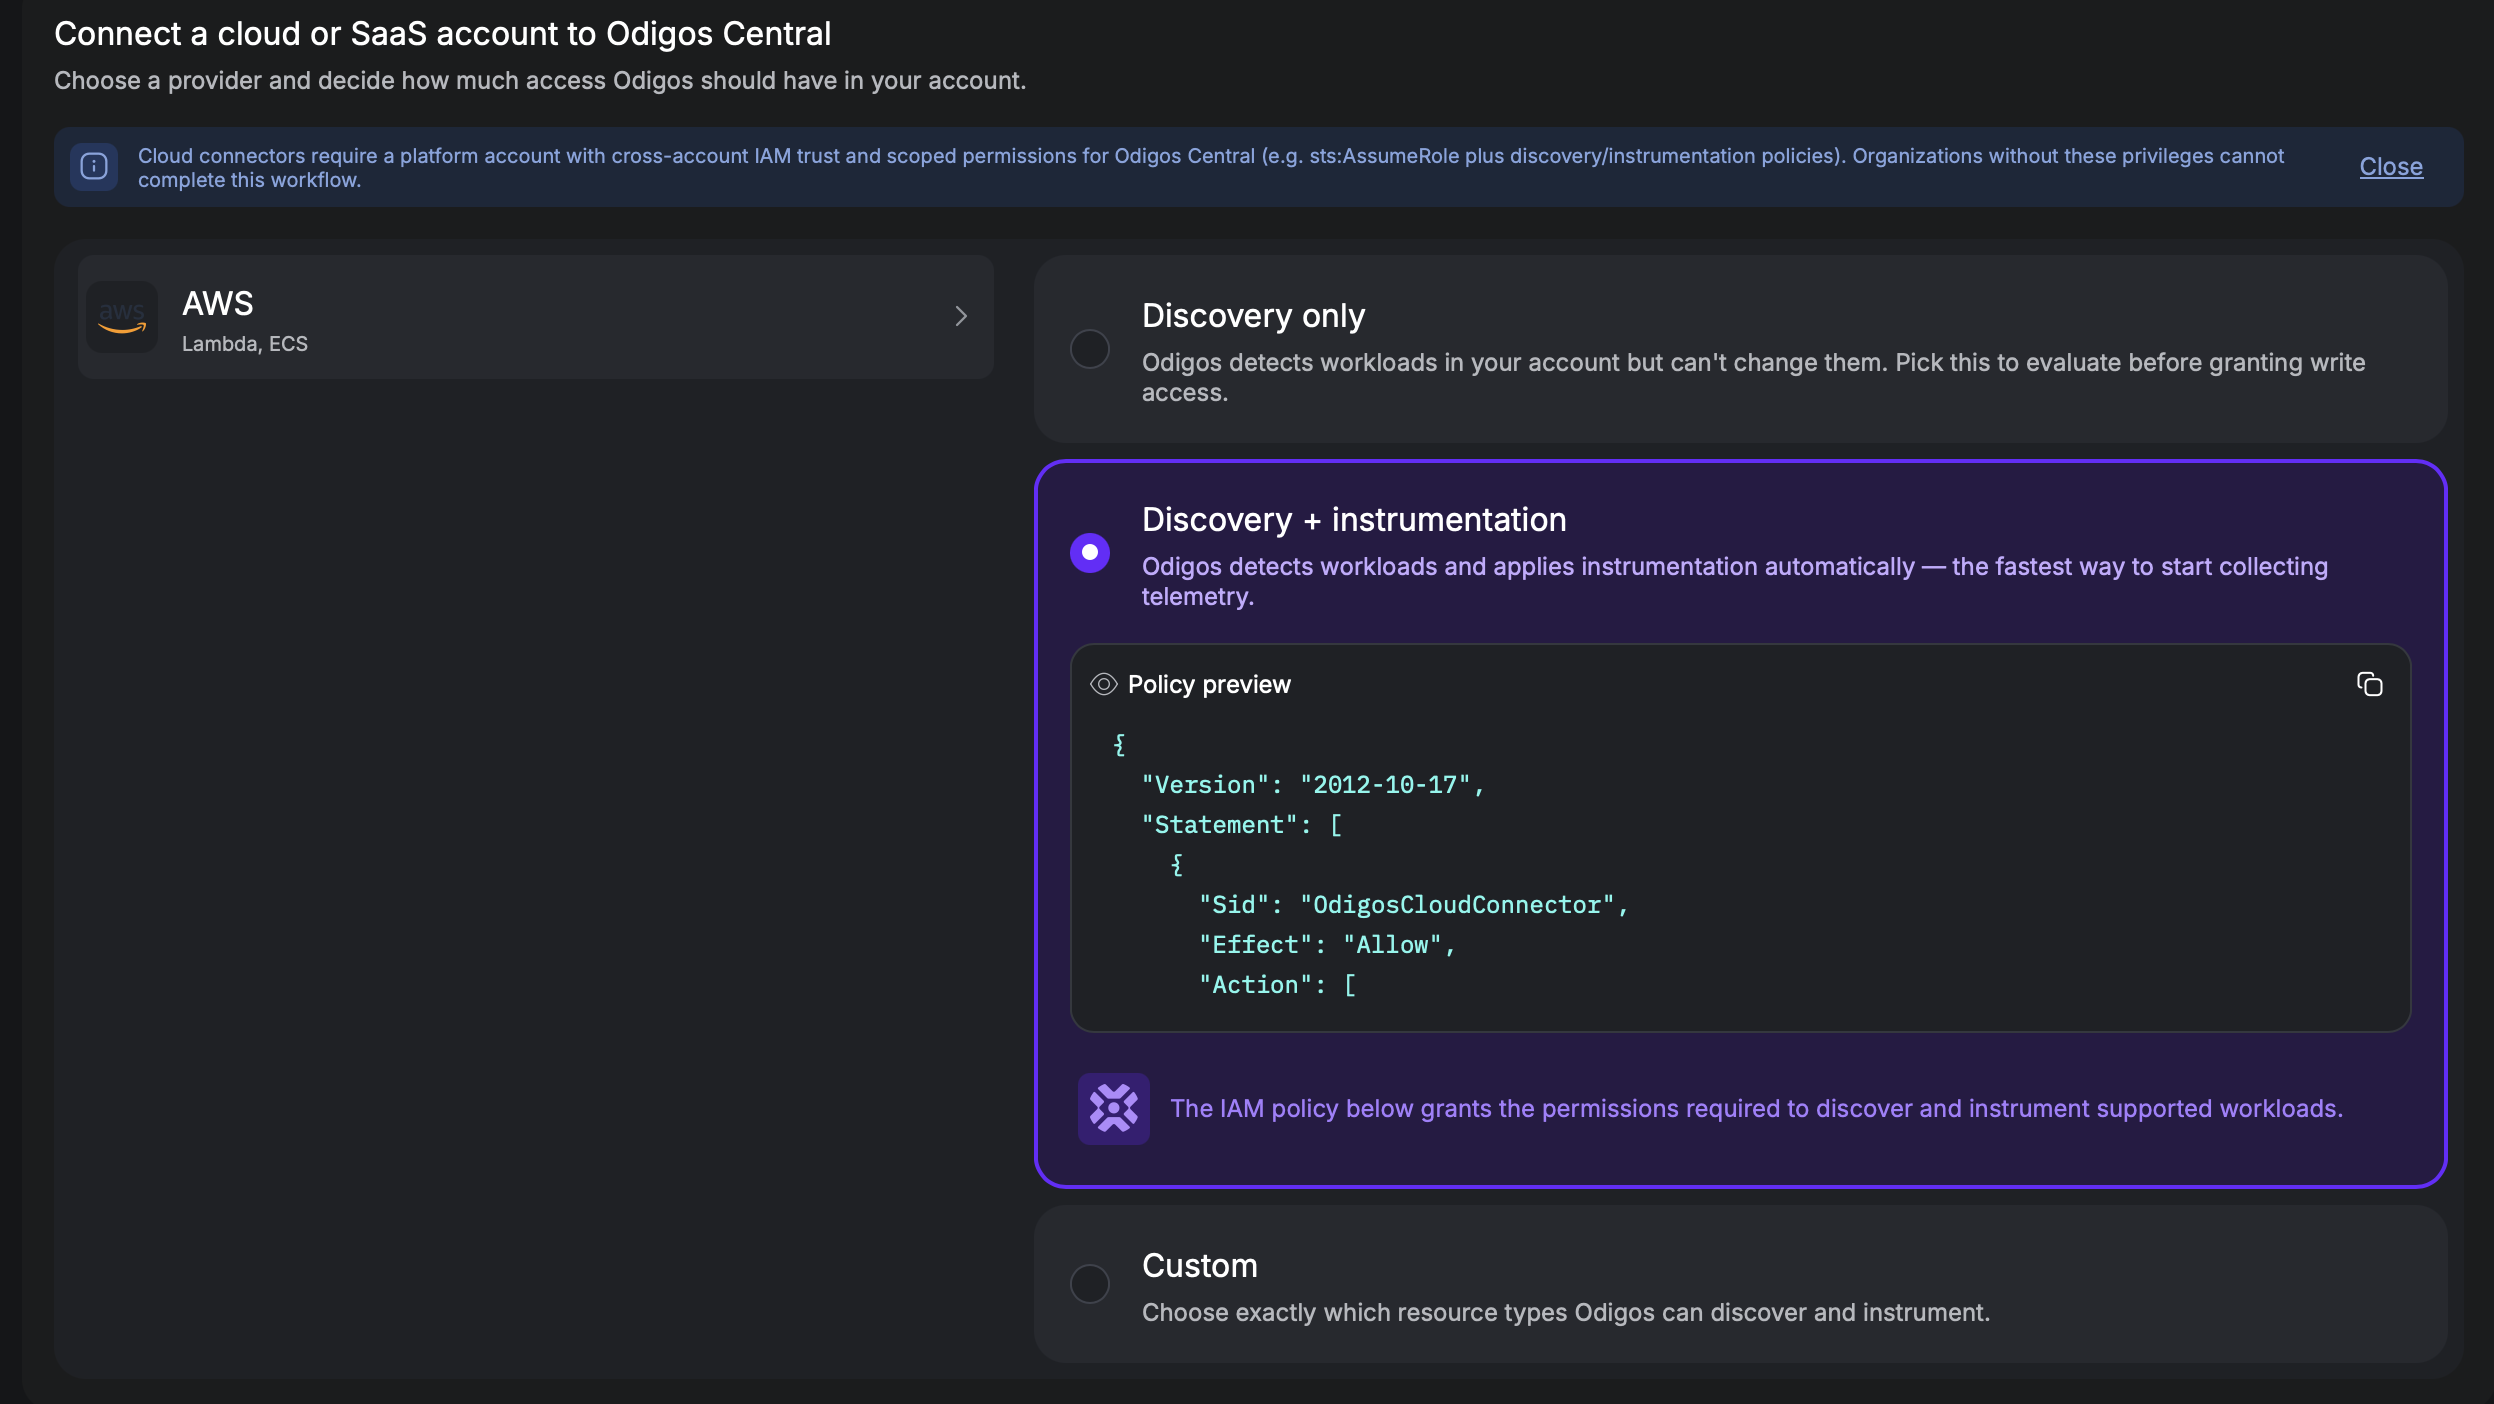
The UI shows the IAM policy for the level you selected. Credentials are stored as Kubernetes Secrets in the Central cluster. One connector owns one account, which keeps ownership and blast radius clear. For AWS, prefer Assume Role with an External ID - see Add an AWS Connector.
For each workload type you can also choose:
- Odigos-managed - Odigos attaches and reconciles instrumentation (for example a Lambda layer or Fargate sidecar)
- Self-managed - you apply changes through CloudFormation, CDK, or Terraform; Odigos discovers and reports status only
Use one approach per workload, not both.
Instrumenting workloads
After discovery, create a Source, configure an OTLP destination reachable from the cloud environment, and enable the Source. Central reports when the workload is instrumented and emitting telemetry:
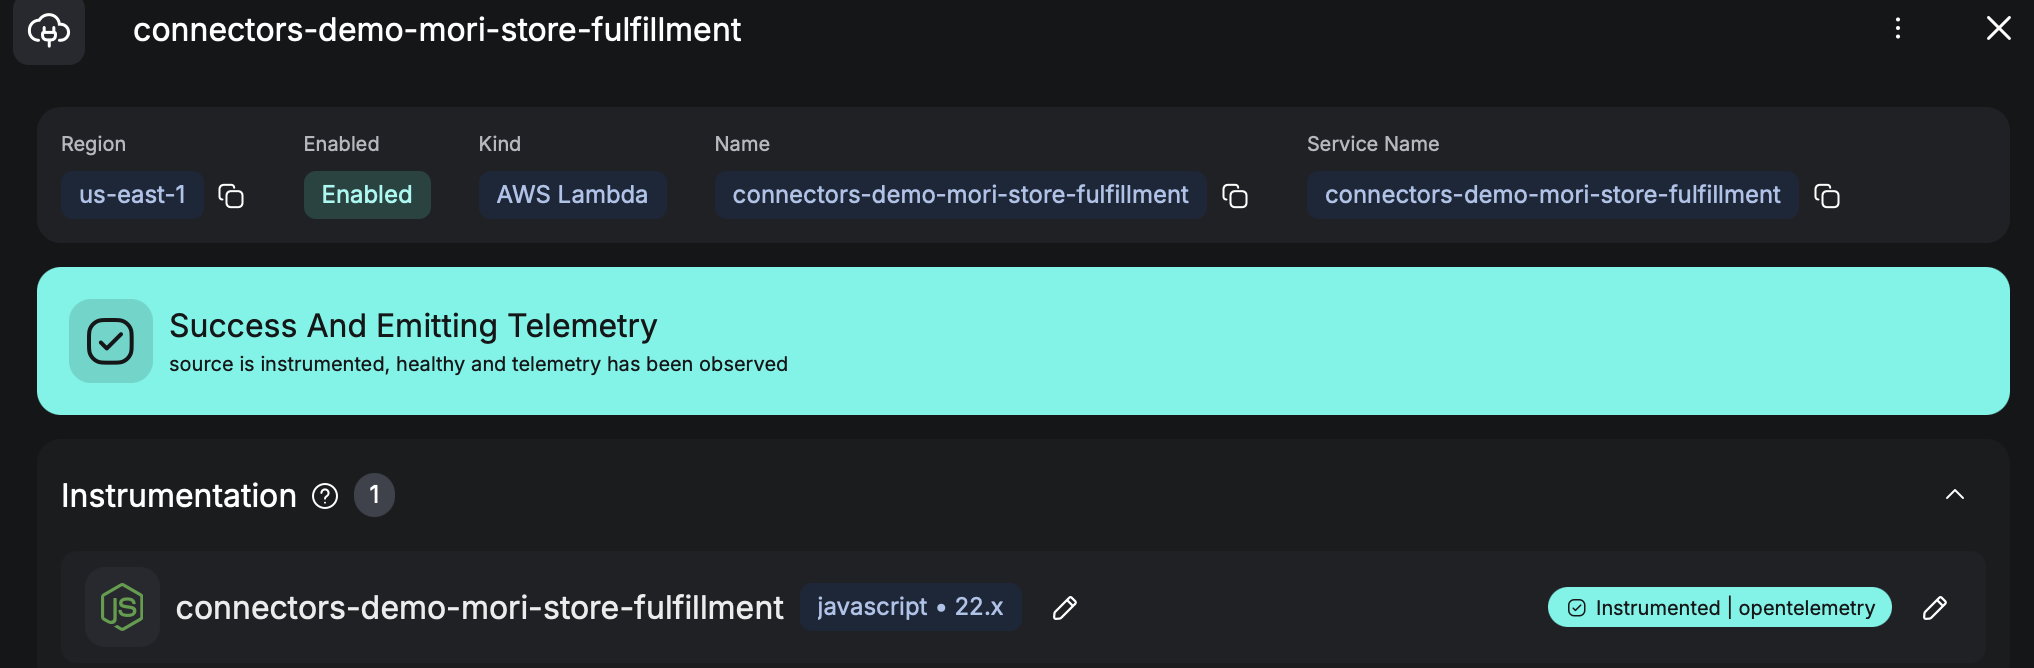
Current coverage includes AWS Lambda and ECS Fargate tasks, plus GCP Cloud Run. Additional compute platforms are on the roadmap. Language support depends on the workload type - see the overview for the full matrix.
Instrumented workloads export OpenTelemetry over OTLP. The destination must be reachable from Lambda or the Fargate VPC, not only from the Central cluster.
Getting started
- Install Odigos Central and enable Cloud Connectors
- Add an AWS or GCP connector
- Wait until the connector is Connected and discovery finishes
- Attach an OTLP destination, create Sources, and confirm telemetry - details in Instrument Cloud Workloads
Cloud Connectors bring serverless into the same Central workflow as clusters and VMs: discover, select, and instrument, with scoped access and optional IaC ownership.
Start with the Cloud Connectors documentation, or get a demo.
More from the blog.


Stop guessing. Ask production.
One agent. One service. See how Odigos helps answer a production question.