
Building an Odigos Observability Pipeline with Kubernetes CRDs and CI/CD
Walkthrough of using CI/CD to add sources, destinations, rules, and actions to Odigos
Observability as Code - Controlling your Odigos pipeline with CI/CD
Over the past few months, I’ve spoken with many developers and platform engineers who are adopting Odigos to deliver better observability in their Kubernetes environments. A recurring theme in these conversations is that users want full control over their observability pipelines through CI/CD. Rather than configuring Odigos’s pipelines within the UI, teams increasingly want to define everything (from instrumentation rules to destinations) declaratively in Git and deploy it via pipelines. This not only aligns observability with infrastructure-as-code principles, but also enables consistent, auditable, and scalable Odigos pipelines across environments.
This blog aims to answer the most common questions I’ve received from these teams. I will walk through a practical example of how to create an observability pipeline using Odigos’s CRDs and CI/CD workflows. I will show examples on how to define your sources, destinations, sampling actions, and instrumentation rules all from YAML config. Whether you're a platform engineer building a paved path or a developer looking to better understand how Odigos fits into your CI/CD strategy, this post will give you a solid, production-ready foundation.
Install Odigos
Before we dive into building the pipeline, make sure you have Odigos already deployed and running in your Kubernetes cluster. This post assumes you're starting from an empty pipeline. In other words, Odigos is installed, which registers the relevant CRDs we will be using, but no sources, destinations, sampling rules, or instrumentation rules have been configured yet.
You can install Odigos using Helm with:
helm repo add odigos https://odigos-io.github.io/odigos/
helm repo update

helm upgrade --install odigos odigos/odigos \
  --namespace odigos-system --create-namespace \
  --wait
Once all odigos pods are up and running, port forward the UI service and you can access the Odigos UI at: http://localhost:3000/overview
kubectl port-forward -n odigos-system svc/ui 3000:3000
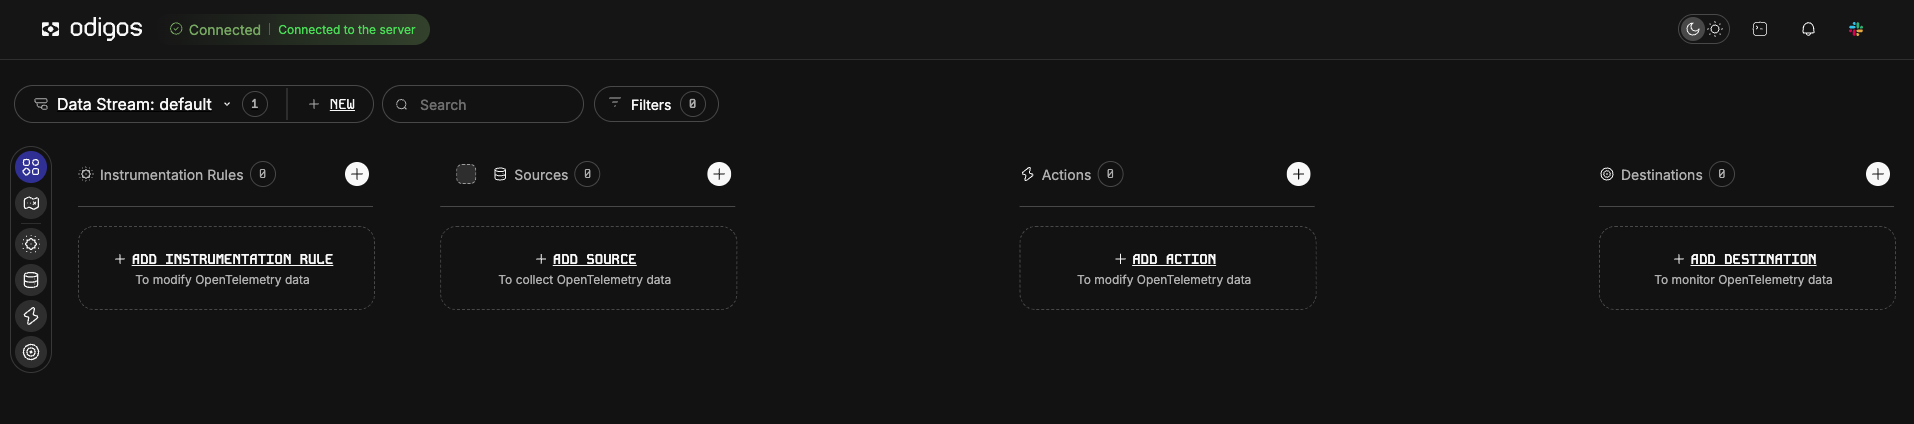
You should have an empty pipeline in the UI, meaning there are no Instrumentation Rules, Sources, Actions, nor Destinations. Let's change that - but through YAML config!
We will walk through configuring the Odigos pipeline using four core CRDs:
- Destination: where your telemetry data goes (e.g., Jaeger, Datadog)
- Source: which services or namespaces to auto-instrument
- LatencySampler: how traces are selectively captured
- InstrumentationRule: how to enrich traces with code-level metadata
Each CRD serves a unique purpose in the pipeline and fits cleanly into a CI/CD workflow.
Source - What Odigos Instruments
Sources are custom resource objects that reference a workload (such as a k8s deployment) or a namespace. These objects act as declarative instructions for how Odigos should configure instrumentation for the referenced entity. When you create or modify a Source, Odigos reacts to those changes and applies instrumentation automatically, without requiring you to modify the target workload itself. This decoupled design allows you to manage observability independently from application deployments. To identify a workload or namespace, a Source must set spec.workload.name, spec.workload.namespace, and spec.workload.kind, and it must exist in the same namespace as its target.
Beyond these minimal requirements, Sources should be treated as their own objects. For example, stored in separate YAML files (like sources.yaml) and maintained apart from workload manifests. This separation of concerns enables clean, GitOps-friendly workflows where observability can evolve independently. Additionally, you can apply fine-grained RBAC to limit who can modify Sources, allowing observability teams to instrument services without needing access to the workloads themselves.
Here is an example source object we will use to create sources for all deployments in the kv-mall and kv-mall-infra namespace:
apiVersion: odigos.io/v1alpha1
kind: Source
metadata:
  name: namespace-source-kv-mall
  namespace: kv-mall
spec:
  workload:
    name: kv-mall
    namespace: kv-mall
    kind: Namespace
---
apiVersion: odigos.io/v1alpha1
kind: Source
metadata:
  name: namespace-source-kv-mall-infra
  namespace: kv-mall-infra
spec:
  workload:
    name: kv-mall-infra
    namespace: kv-mall-infra
    kind: Namespace
Destination - Where Odigos Sends Telemetry
The Destination CRD defines where Odigos should send telemetry data like traces, metrics, and logs. This can be a backend such as Jaeger, Tempo, Dynatrace, Datadog, or even another OTLP collector. For the full list of supported destinations see our destinations page in the documentation site.
For this pipeline that we are building lets add Jaeger as a destination. Note that you can always add more than one destination by creating an additional custom resource. Here is what our Jaeger Destination object looks like:
apiVersion: odigos.io/v1alpha1
kind: Destination
metadata:
  name: jaeger-example
  namespace: odigos-system
spec:
  data:
    JAEGER_URL: jaeger-collector.default.svc.cluster.local:4317
  destinationName: jaeger
  signals:
    - TRACES
  type: jaeger
This example will send traces from the sources we created in the previous step into Jaeger over the OTLP gRPC protocol.
Actions - Tailor What You Capture and How
Odigos supports a growing set of pipeline actions that give you fine-grained control over telemetry data as it is captured, enriched, and sent to observability backends. These actions operate at the data processing level, transforming or filtering traces, metrics, and logs based on your specifications. Actions allow you to:
- Filter traces based on latency or error conditions
- Tag telemetry with Kubernetes labels or annotations
- Attach team ownership or service metadata
- Apply PII masking rules to sanitize sensitive payloads
- Route signals conditionally based on context This makes it easy to enforce observability policy across teams, services, and environments - all declaratively through a CI/CD pipeline.
Lets create a Latency Sampler in our pipeline to filter out all my junk traces like keepalives. We can define the Threshold, HTTP Route, Fallback, and Service Name in the Latency Sampler. This significantly helps reduce the telemetry volume by only keeping high-latency traces, the ones that matter most for debugging.
apiVersion: actions.odigos.io/v1alpha1
kind: LatencySampler
metadata:
  name: frontend-latency-sampler
  namespace: odigos-system
spec:
  endpoints_filters:
    - service_name: frontend
      http_route: /keepalive
      minimum_latency_threshold: 3000
      fallback_sampling_ratio: 0
  signals:
    - TRACES
This example captures only traces for /keepalive on the Frontend service that take longer than 3 seconds, while ignoring all other traffic. This approach lets us preserve high quality signals without overloading Jaeger. After all, if a keepalive is taking longer than 3 seconds its worth investigating...
Instrumentation Rule - Enrich Your Traces
Instrumentation Rules define how telemetry is captured from your applications. Each rule can target specific workloads and apply settings to the instrumentation libraries used to generate traces, metrics, and logs.
For example, we can create a Code Attributes instrumentation rule that allows us to enrich spans with semantic metadata about the source code. This makes it easier to trace an operation back to the exact location in the codebase where it originated. It includes details like stacktraces, file paths, function names, and line numbers.
Here is our configuration for the Instrumentation rule in the Odigos pipeline we are building:
apiVersion: odigos.io/v1alpha1
kind: InstrumentationRule
metadata:
  name: ui-instrumentation-rule
  namespace: odigos-system
spec:
  codeAttributes:
    column: true
    filePath: true
    function: true
    lineNumber: true
    namespace: true
    stackTrace: true
  customInstrumentations: {}
  payloadCollection: {}
This enables deep code-level visibility for all instrumented services in the kv-mall namespace.
Time to Deploy
By now, we have created four Odigos resources: Sources, Destination, Instrumentation Rule, and Action. These should be created and stored within a GitHub repository, since we are using a GitOps pipeline to deploy these resources. You can take a look at our GitHub repository to create these exact resources. You will notice in the odigos-pipeline-deploy/odigos folder that we have a single concatenated YAML called DeployAll.yaml to create all four objects from a single command.
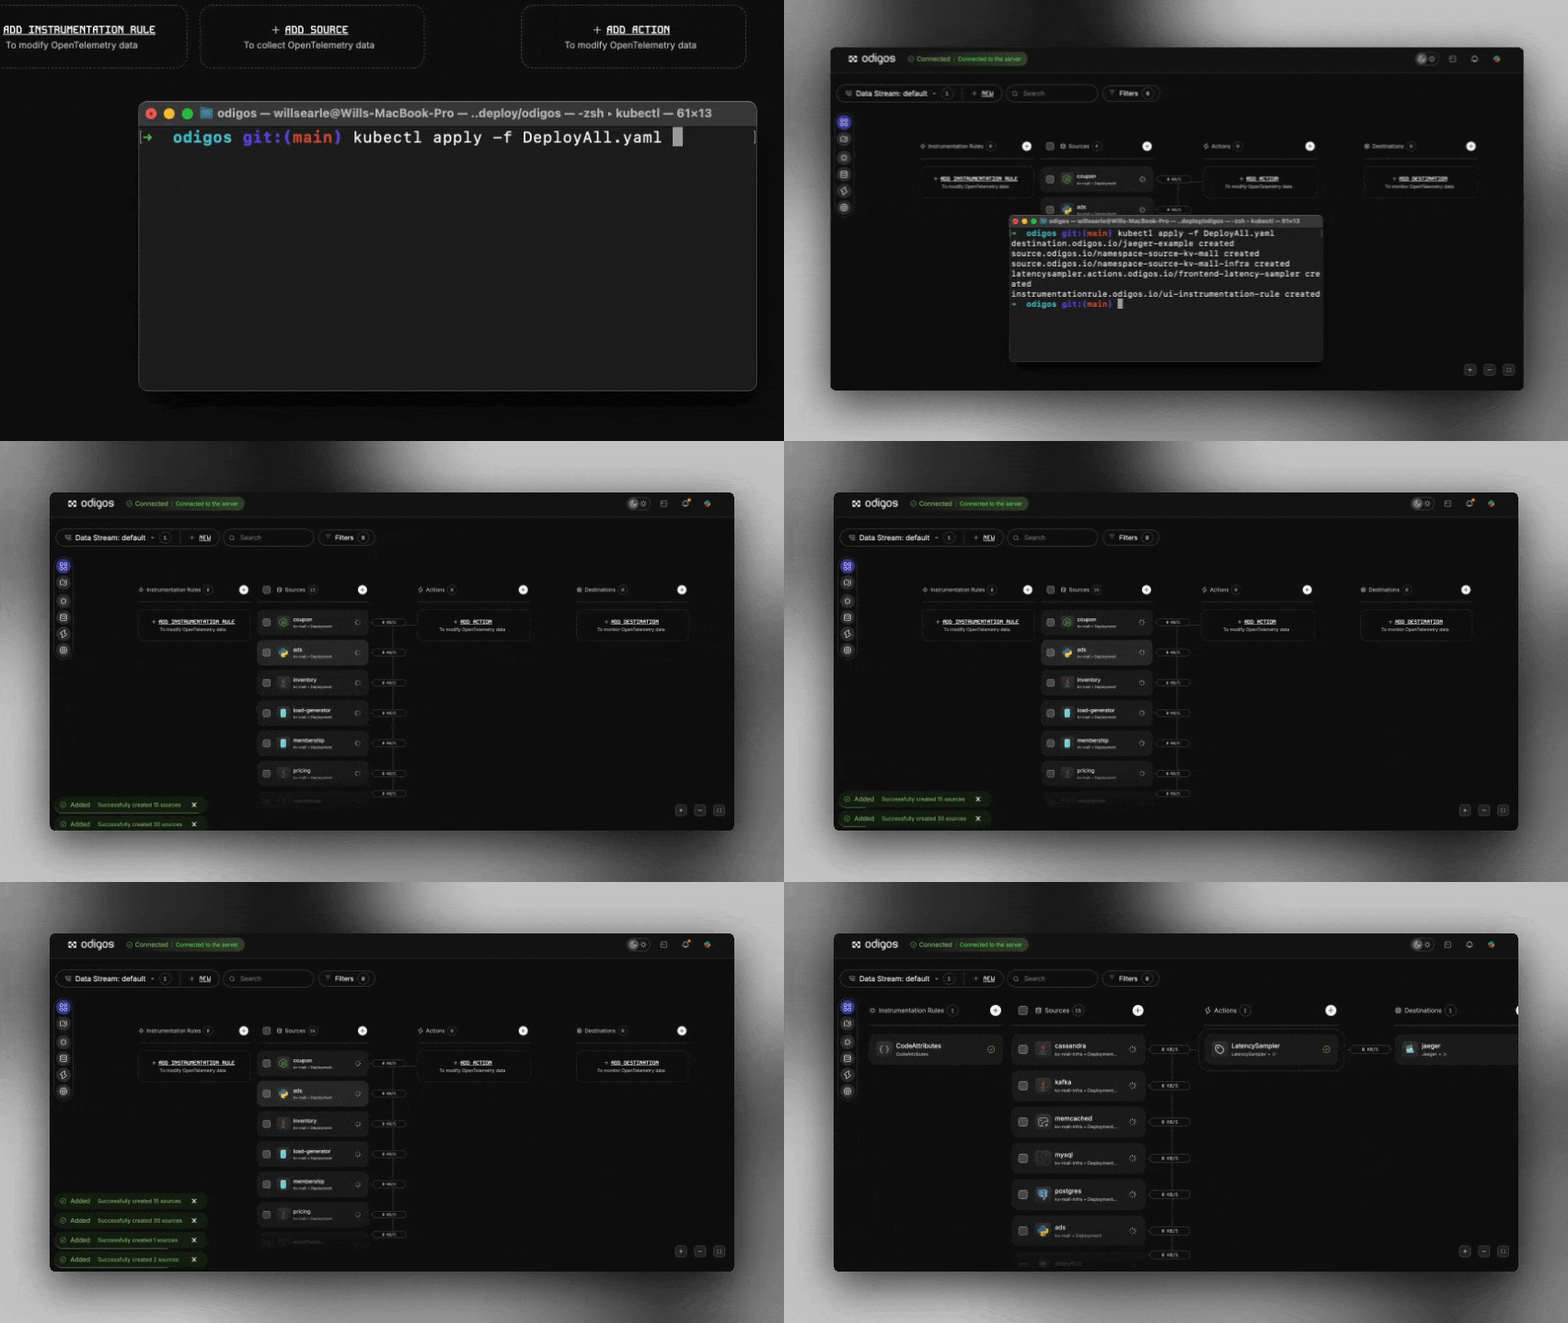
So from here we can either create an actions workflow, or clone the repo locally and push our changes from the cloned repository. If I clone my repository and run the command:
kubectl apply -f DeployAll.yaml
This should create all resources and build my pipeline instantly within Odigos!
Observability, Declaratively Done
In this post, we walked through how to declaratively build an Odigos observability pipeline using CRDs and how to manage that pipeline through CI/CD. Starting from a blank-slate Odigos installation, we defined a telemetry destination (Jaeger), configured namespace-wide auto-instrumentation, applied intelligent sampling based on latency, and enriched traces with valuable code-level metadata.
By defining everything as YAML and storing it in version control system like GitHub, we not only gained full visibility into our systems, but also made observability a repeatable, auditable, and automation-friendly part of the software delivery process. Whether you're managing one cluster or many, this approach scales cleanly and keeps your telemetry pipeline consistent across environments. Thanks to Odigos, observability as code is not just possible... it is now practical.
More from the blog.



Stop guessing. Ask production.
One agent. One service. See how Odigos helps answer a production question.