Odigos
Get a demo
Odigos
Technology

Everyone else’s eBPF stops at the syscall.

Our own eBPF runtime reads what happens inside a running process: the functions that ran, the arguments they carried, the values they returned, in every language. Whatever you ask for, it captures on request, and Autofocus captures on its own the moment a service drifts. Everything exports as OpenTelemetry. Nothing loads into your application to do it.

Read the docs
process
binary
symbols
layout
frame
captured out of process
code "BLACK50"
returned 0.00
cost 0.4% CPU
what did applyDiscount return on order 4471resolving the service and its binarystripped, statically linked Go, no symbolsno debug info reading the binary layout insteadlocating the function and its frameattaching an eBPF probe, outside the processreading arguments and the return value
capturednothing loaded into the application to do it
The part that took years

Inside the process. Nothing in it.

Three things at once, which is the part that took years: function-level depth, captured on demand, from entirely outside your process.

01 / 03

eBPF was built for the kernel. We made it see inside the application.

Off-the-shelf eBPF sees syscalls and network traffic. Ours reads inside the process: the functions that ran, the queries they made, the arguments they carried. Including a stripped, statically linked Go binary, which is the case most tools give up on. Nothing loads into your application to do it.

our own eBPF runtimeevery languagefunction-level depth
A different kind of eBPF
everyone else stops herethe syscall
POST /orders214ms · 200 OK
GET /cart31ms · 200 OK
that is the whole story they can tell
the edge of your service
odigos reads hereinside the code
applyDiscount("BLACK50", $49.00)
returned $0.00on every call
the value that explains the drop, out of a running service
02 / 03

It follows the drift into the code before anyone asks.

When a service starts to degrade, Autofocus moves capture onto that path on its own: the functions that ran, their arguments, what they returned, the calls underneath. Point at any other function and it captures that too, inside running production, in seconds. Scope, masking and approval are set once by your team; every capture lands in the audit trail.

Autofocusno redeployssafe in production
Odigos Autofocus
AI agent
investigating
Production
342 services
asks ❯ capture goroutine stack for checkout
stack + 14 spans returnedlive
03 / 03

Out of process. Out of your blast radius.

Other ways of getting this depth run inside your process, one bad agent release away from taking the app down with it. Ours never touches your process. Under 1% CPU, safe to leave on across the whole estate, with RBAC and policy controls over what may be captured and by whom.

out of processno agent in your appRBAC & governance
Safe on all of production
<1%
CPU overhead
out-of-processkernel-enforcedno in-process agent
What a capture is

Every capture is one line you can read.

A capture names a workload and a function. Autofocus opens them when a service drifts; engineers and AI agents open them on request. Either way it is scoped per cluster, reversible, and governed by RBAC, so reading a value out of production is an action somebody authorised rather than a side effect of an AI agent.

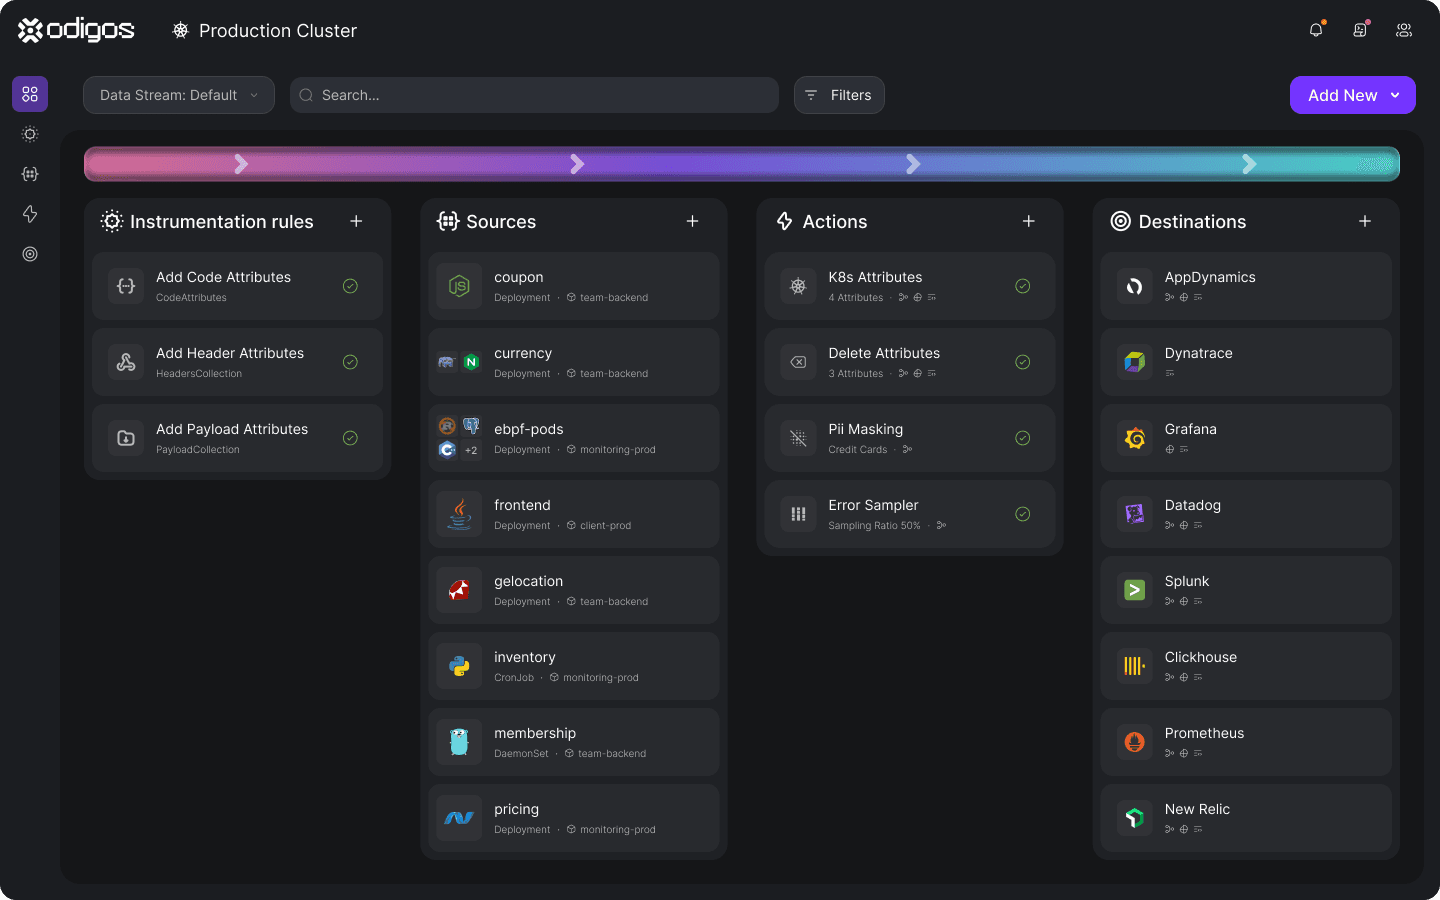
The Odigos console: detected sources, in-flight actions and export destinations for a production cluster
How it works

One command. Nothing changes in your applications.

Odigos installs on the cluster, finds every service, and starts producing OpenTelemetry from all of them with no code change. One Fortune 500 swapped out the bytecode agent in its process on 1.04 million cores and measured the difference. The backends you already pay for keep getting fed.

1
Install

One command, any environment

Run one command on Kubernetes or Linux. Odigos finds every service, works out what language it runs and what it talks to, and starts there. You do not tell it anything.

odigos install
2
Capture

Inside the application, outside your code

Our own eBPF runtime reads what happens inside each service as it runs: the code paths taken, the queries made, the values carried. Nothing is wired into your applications.

eBPF probe attachedargumentsreturn valuesstacks
3
Ask

Autofocus on the drift

When a service drifts, Autofocus captures deeper on that path before anyone asks. Anything else is captured live on request. All of it exports as OpenTelemetry into whatever you already run, and into the AI agents that do the asking.

DatadogGrafanaSplunkyour AI
Coverage

What it reads, and where it sends it.

Automatic language detection on install. Nothing to declare, nothing to annotate, and the export format is the one you already own.

Languages
GoJavaPythonNode.jsRustC++stripped static binaries
Where it runs
Kubernetesvirtual machinesbare metalLinux
What it captures
tracesmetricslogsfunction argumentsreturn valuescall stacks
Where it goes
any OpenTelemetry backendDatadogGrafanaSplunkyour AI agents
One command. Kubernetes, VMs, bare metal.

Install today. First answer tomorrow. Security on the same install.

Get a demo

One record, every purpose. One service, fourteen days, success criteria written first.