
Tracing legacy C++ on RHEL 7 with eBPF
Tracing legacy C++ on RHEL 7, including CORBA and FIX, with Odigos. No code changes, plus custom spans and SLOs.
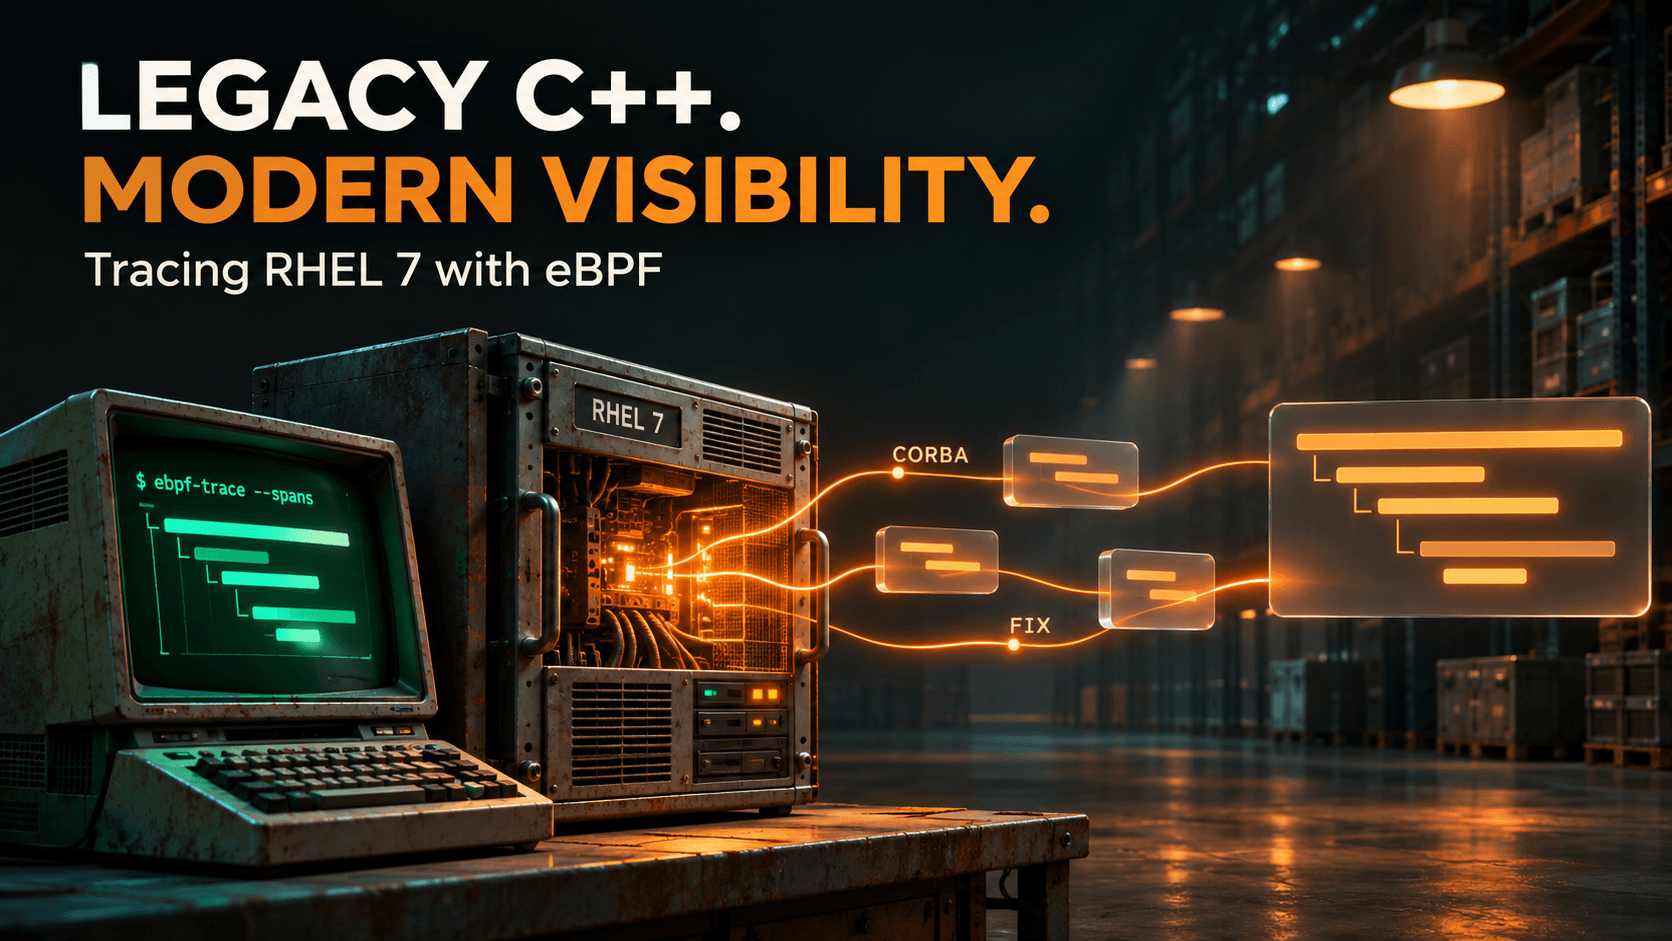
Every large enterprise has one: a system that runs a critical function of the business, was written in C++ fifteen years ago, and still runs on RHEL 7. Warehouse management, order routing, trade execution. The original developers are gone, the vendor ships binaries, and nobody wants to touch it. When it misbehaves, SREs grep logs on five boxes and guess.
This post walks through how I got distributed traces out of exactly that kind of system with Odigos: what makes it hard, what I built to test it, and what the result looks like.
Why C++ on RHEL 7 is so hard to instrument
The usual answer to get tracing from legacy code is a SDK and manual code changes. For a third-party C++ app on a very old kernel every part of that answer breaks.
- You can't change the code. The OpenTelemetry C++ SDK means editing and recompiling every service, then wrapping every call. With vendor binaries and no one who knows the code, that is off the table.
- The protocols aren't HTTP. CORBA speaks binary GIOP, and FIX is tag=value text over long-lived TCP sessions. There is no auto-instrumentation library for either, so most tools see opaque TCP or nothing at all.
- The kernel predates modern eBPF. RHEL 7's 3.10 kernel has backported eBPF, but no BTF type information, no ring buffers, no bounded loops, and no way for probes to write to user memory. Most eBPF agents (other than Odigos ;) ) require a 5.x kernel and simply don't load.
These are the challenges I wanted to tackle with Odigos.
The test app: a fake warehouse management system
To test this, I (with the help of Claude) built a small app designed like a legacy distribution-center WMS. It has 13 C++ services, each its own process, on one RHEL 7.9 VM. Orders arrive, waves get planned, stock gets allocated, and voice headsets pick and ship. Replenishment orders go out to a supplier over FIX.
The services talk to each other the way old systems do:
| Protocol | What uses it in the app |
|---|---|
| CORBA (GIOP over TCP, omniORB) | All service-to-service calls: orders, waves, allocation, inventory, tasks, receiving, shipping |
| FIX 4.4 | Purchase orders from replenishment-svc to a simulated supplier |
| Telnet / VT100 | RF gun terminal screens for pickers and receivers |
| SIP over UDP | Voice-directed picking headsets |
| HL7 v2 over MLLP | Safety incident reports to an occupational-health clinic |
| HTTP + JDBC | A small Java gateway in front of PostgreSQL |
A load generator drives a realistic shift: orders flowing in, pickers on RF guns and headsets, receivers, and the occasional safety incident. It also injects faults, such as scan mismatches, slow carrier calls and supplier rejects, so the traces have real failures to find.
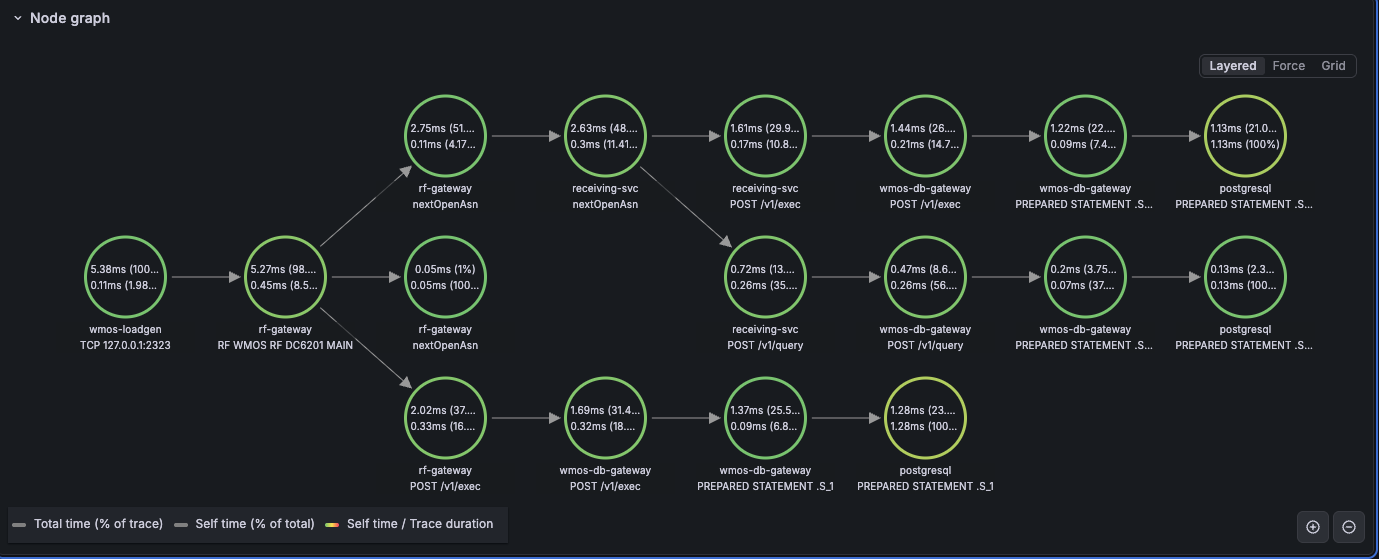
The whole setup is two RPMs and a license. No code changes, no recompiles, no SDKs.
-
Install the agent.
sudo dnf install -y ./odigos-otelcol-<otelcol-version>.rpm ./odigos-<agent-version>.rpm
odictl -odigos-license '<your license>'
On startup, the agent detects the 3.10 kernel and switches to its RHEL 7 tracer automatically.
-
Point it at your backend. I sent traces over OTLP to Grafana Tempo. Any OTLP destination works.
-
Pick the processes. Run
odictl, select the 13 C++ services and the Java gateway, and confirm.
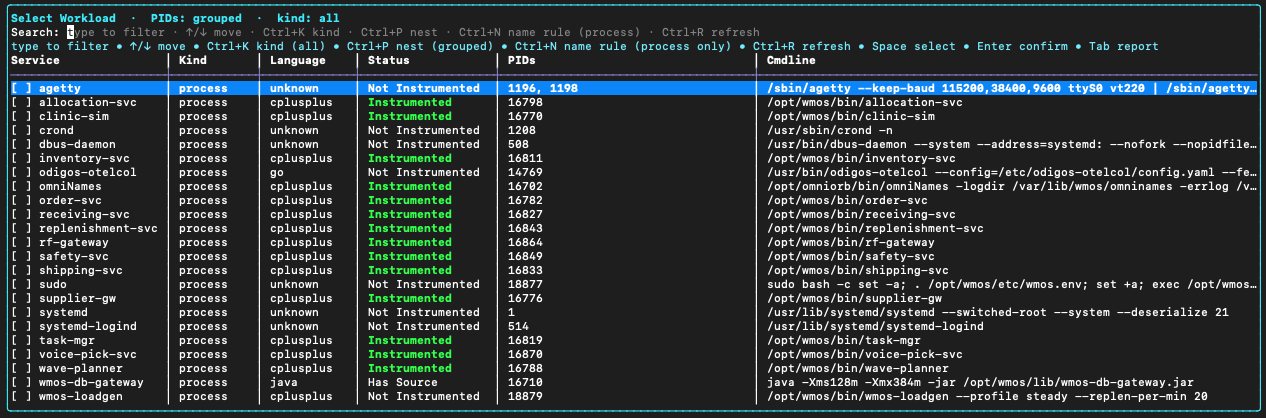
Within a minute, traces start arriving. Here's a single RF gun pick confirmation. It starts at the RF gun's terminal screen, which Odigos decodes into a span with the screen name and the key the picker pressed. From there it crosses task-mgr and inventory-svc over CORBA and ends in PostgreSQL:
The CORBA spans carry the operation name and its first argument (corba.request.arg0), such as the task or SKU ID. That's often enough to find the exact order a user is complaining about.
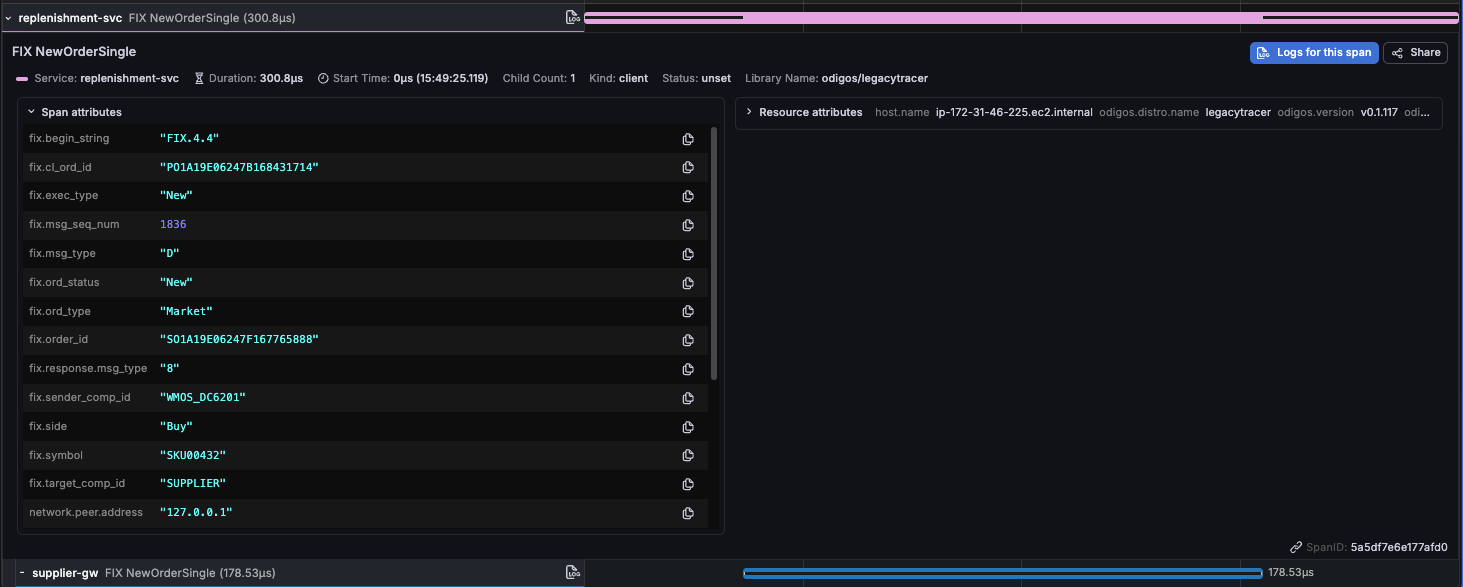
FIX traffic gets the same treatment. Each NewOrderSingle shows up as a client span in replenishment-svc linked to the supplier's server span, with attributes like fix.cl_ord_id, fix.symbol and fix.exec_type.
Going deeper: custom spans from C++ function signatures
Protocol spans show you calls between services. Sometimes the slow part is inside a service, in a function no protocol ever sees. For that, Odigos can turn any C++ function in the binary into a span, using only its symbol discovered by CPU profiling.
In my app, the shipping service calls a carrier rate-shopping function before every shipment. It's the slowest step in the order flow, and it lives entirely inside shipping-svc.
The rule uses the readable C++ name from the CPU profile, and every call to RateShipment became a span nested under the CORBA packAndShip request.
The rule is added with the odictl TUI and is a small yaml file:
name: wmos-business-logic
type: CustomInstrumentation
enabled: true
notes: "Function-level spans for the WMOS services"
config:
  cpp:
    - signature: "wmos::ship::RateShipment"
    - signature: "wmos::task::ValidatePick"
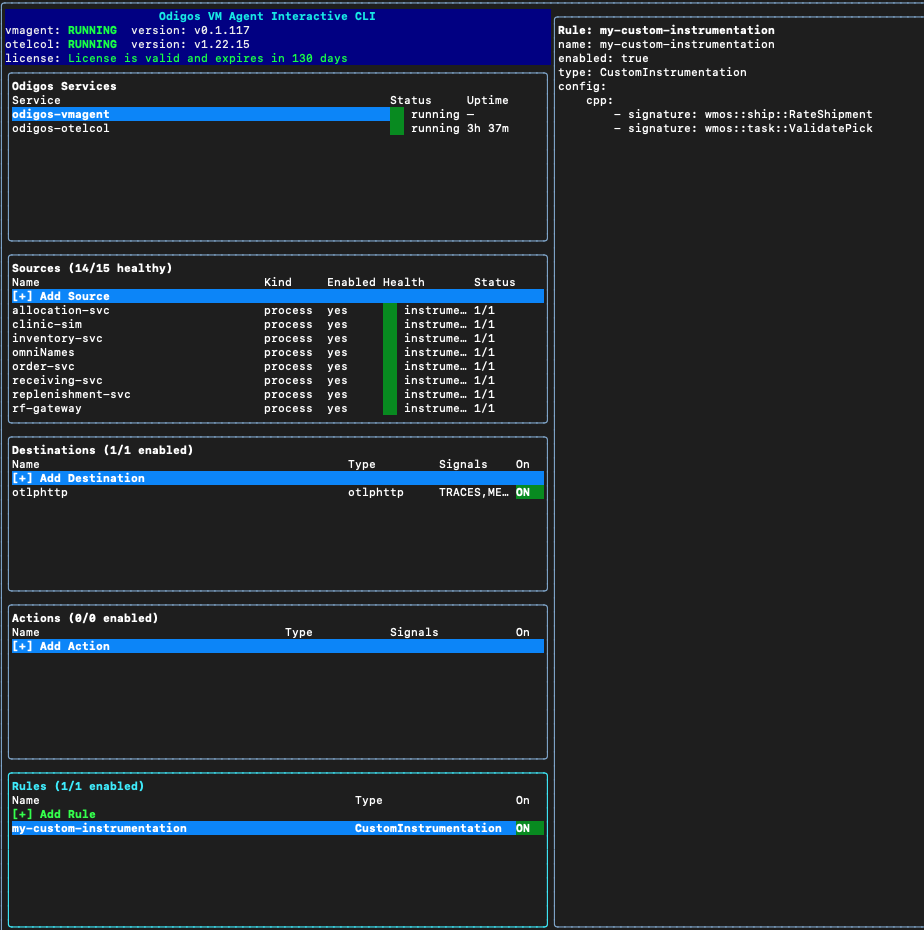
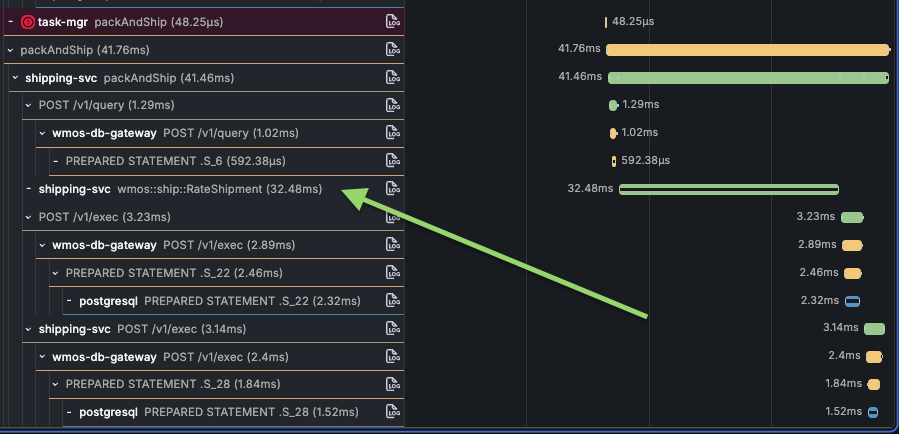
The same works for business logic. A probe on wmos::task::ValidatePick shows exactly how long pick validation takes, and how often it rejects a scan, without anyone reading the source.
From traces to SLOs
Once the traces exist, SLOs come almost for free. Every panel on my dashboard is a TraceQL metrics query against Tempo, computed straight from the span metrics Odigos produces. There are no extra exporters and no metrics instrumentation.
I defined SLOs around what a DC operations team actually cares about:
| SLO | Measured from | Target |
|---|---|---|
| Pick confirmations succeed | task-mgr confirmTask CORBA spans, by status | ≥ 97% |
| Pick confirmations are fast | p95 of the same spans | < 250 ms |
| Database calls are fast | p95 of the Java gateway's HTTP spans | < 50 ms |
| Supplier orders go through | p99 of FIX NewOrderSingle spans | < 100 ms |
| Carrier rate-shop keeps up | p95 of shipping-svc packAndShip spans | < 1 s |
The pick success SLI is a single query:
{ resource.service.name = "task-mgr" && kind = server && span.rpc.method = "confirmTask" }
  | count_over_time() by (status)
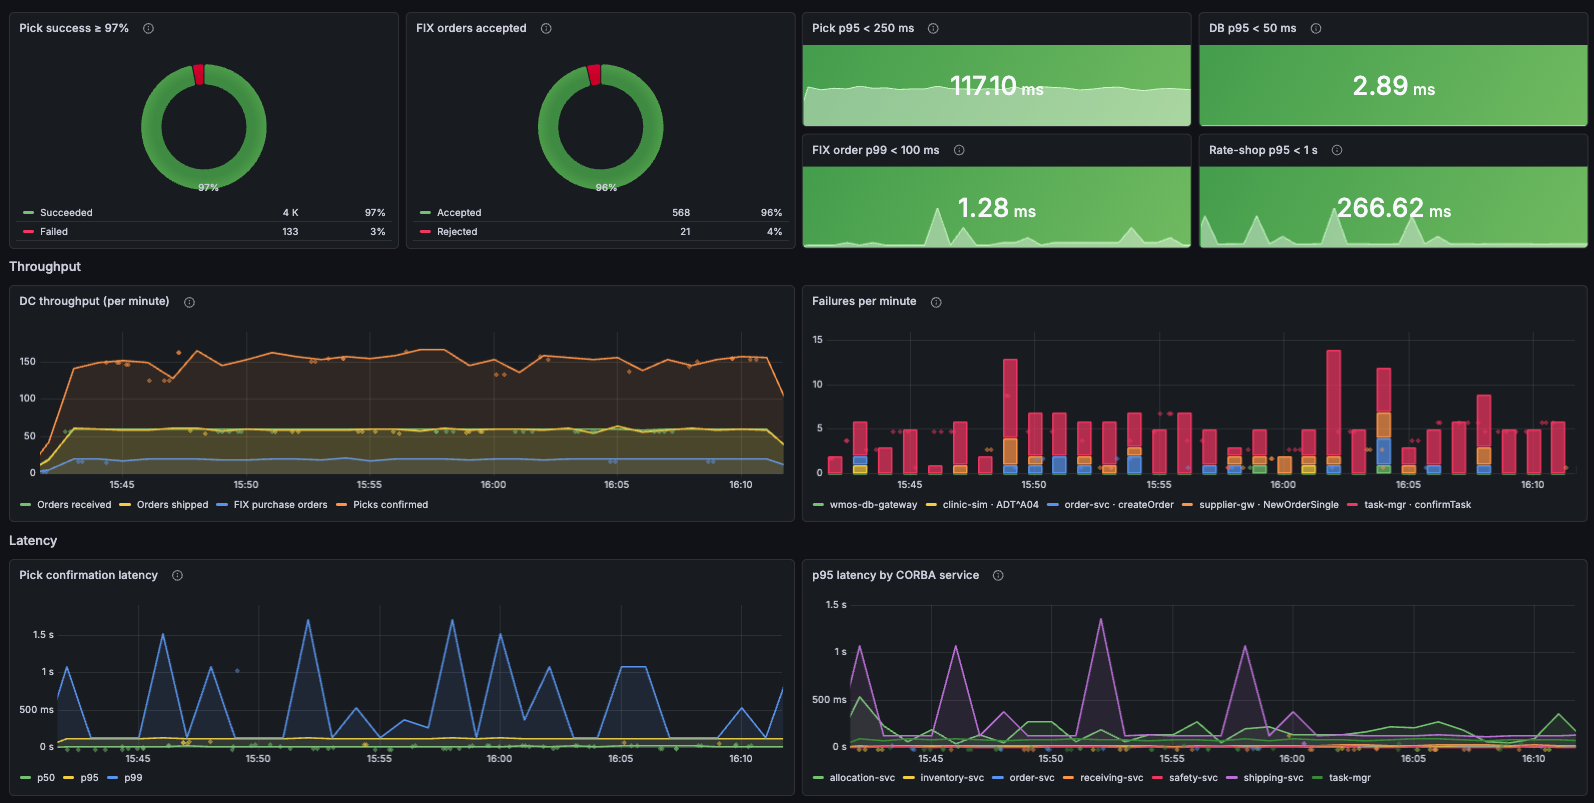
One of the best parts is the drill-down. When the success rate dips, the Failed pick confirmations table lists the failing requests. One click opens the full trace across RF gun, task manager, inventory and database, showing exactly where the pick broke.

Wrapping up
A legacy C++ system on RHEL 7, speaking CORBA and FIX, used to mean no traces at all. With Odigos it took less than 10 minutes to get end-to-end traces, function-level spans and working SLOs. The code never changed.
More from the blog.
Stop guessing. Ask production.
One agent. One service. See how Odigos helps answer a production question.