
Debugging Kubernetes with Cursor and the Odigos MCP
From opaque checkout failures to a verified application fix using Cursor, Odigos, and dynamic instrumentation

Debugging Kubernetes with Cursor and the Odigos MCP: From Opaque 409s to a Verified Fix
Kubernetes incidents do not always begin with a crashing pod or an obvious exception.
Sometimes every workload is running, telemetry is flowing, and the application still is not working correctly.
That was the situation with OdiShop, a small production-like checkout application I deployed on Amazon EKS. Some checkout requests succeeded, while others returned an opaque HTTP 409 response:
{"error":"fulfillment_rejected"}
There was no stack trace in the response, no failing downstream request, and no obvious Kubernetes condition explaining the problem.
Rather than opening Jaeger and manually clicking through traces as my primary workflow, I started in Cursor.
Cursor used the Odigos MCP to inspect the cluster, verify instrumentation, read source conditions, understand the service map, enable profiling, and create instrumentation rules. When trace-level evidence was needed, Cursor queried Jaeger’s API through a local port-forward.
By the end, I went from an unexplained checkout rejection to the exact business decision causing it, without adding temporary logging or redeploying the application for each instrumentation change thanks to Odigos.
The application: OdiShop
OdiShop is a small polyglot checkout application running on EKS.
It contains four application services:
api-gateway— Node.jsorder-service— Java and Springinventory-service— Gopayment-service— Python
The application flow looks like this:
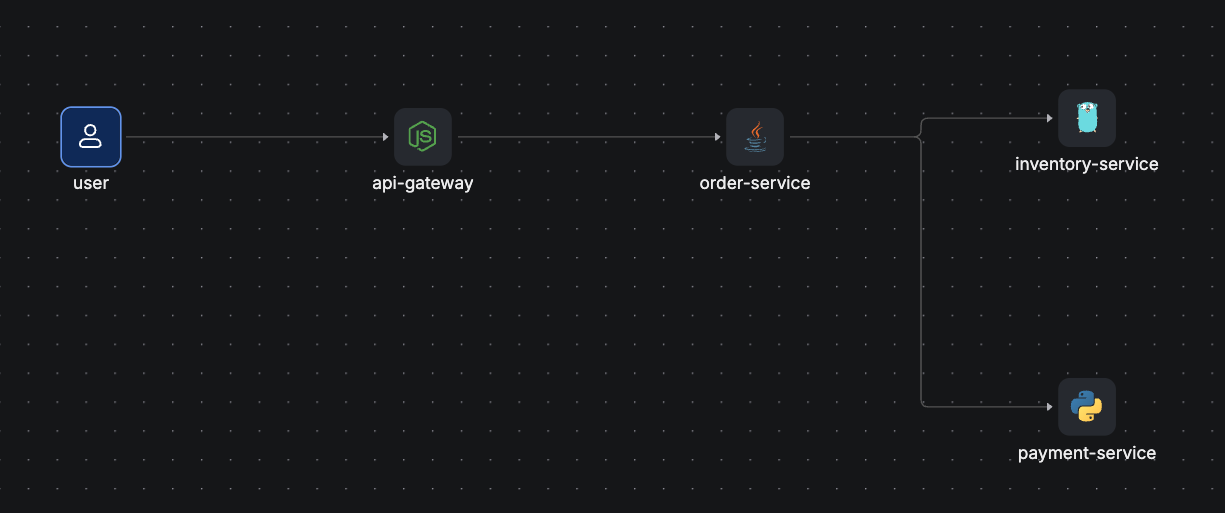
Odigos instrumented all four application services and sent the resulting traces to Jaeger.
The goal was not just to generate a trace.
The goal was to see whether Cursor could move through a realistic troubleshooting workflow using observability data as evidence.
Step 1: Is my OdiShop app healthy?
I started with a deliberately broad prompt.
Is my OdiShop app healthy?
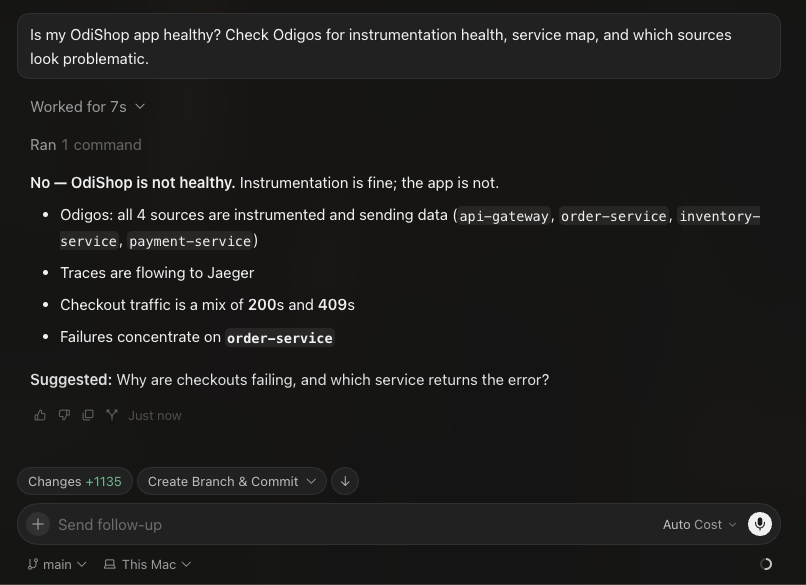
Cursor used the Odigos MCP to inspect the application and its instrumentation state. It also reviewed recent checkout activity through the Jaeger API.
That showed an elevated number of HTTP 409 responses on the checkout path, with the problem concentrating around order-service.
This gave me the first important finding:
Kubernetes: healthy
Odigos instrumentation: healthy
OdiShop checkout flow: unhealthy
Step 2: Which service is returning the error?
Now that I knew checkouts were failing, I asked Cursor to locate the first meaningful failure in the trace.
Why are checkouts failing, and which service returns the error?
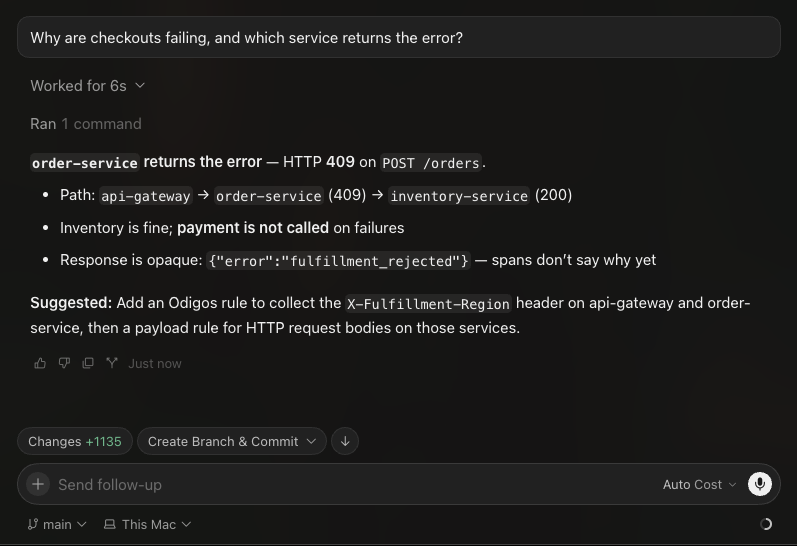
Cursor queried Jaeger through its API and reconstructed the request path.
The failed traces showed:
api-gatewayreceived the checkout request.api-gatewaycalledorder-service.order-servicereturned HTTP409.inventory-servicereceivedGET /stockand returned HTTP200.payment-servicewas missing from the failed trace.
That ruled out several possible causes:
- Inventory was not returning an HTTP error.
- Payment was not rejecting the transaction.
- Payment was never called at all.
- The decision to reject the checkout was happening inside
order-service, after the inventory request completed and before the payment request began. - The problem was that the existing spans did not explain that decision.
The only response body was still:
{"error":"fulfillment_rejected"}
The trace showed where execution stopped, but not why...
Step 3: Dynamically enriching the traces with more context
At this point, I knew the rejection happened inside the Java order service.
I still did not know which request characteristic triggered it.
The checkout request contained context that was not included in the default spans, including a fulfillment header and request body.
Rather than adding temporary application logs and rebuilding two services, I asked Cursor to create instrumentation rules through the Odigos MCP.
Add an Odigos rule to collect the X-Fulfillment-Region header on api-gateway and order-service, then a payload rule for HTTP request bodies on those services.
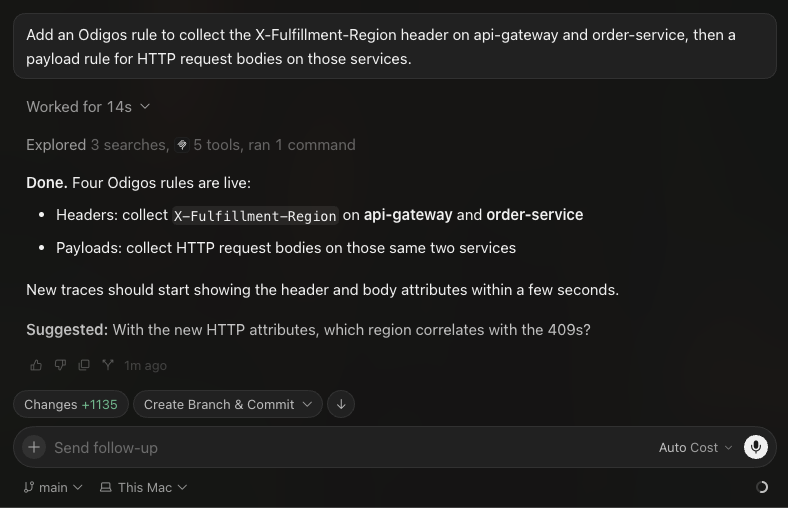
Cursor created two types of rules:
- Header collection for
X-Fulfillment-Region - HTTP request-body collection
The rules were applied to the running services.
There was no application code change and no deployment required for the instrumentation update.
After generating another round of checkout traffic, the new traces included the missing request context.
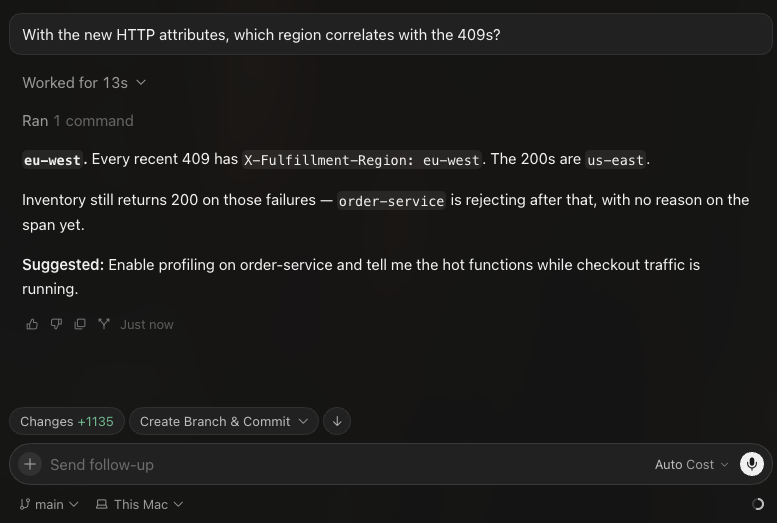
A clear pattern appeared:
- Requests with
X-Fulfillment-Region: eu-westreturned HTTP409. - Requests with
X-Fulfillment-Region: us-eastreturned HTTP200. - The captured request bodies showed the same fulfillment selection.
- Inventory still returned HTTP
200in both cases. - Payment appeared only on the successful path.
The problem was now reproducible.
us-east checkout
    → inventory succeeds
    → payment runs
    → checkout succeeds

eu-west checkout
    → inventory succeeds
    → payment never runs
    → checkout returns 409
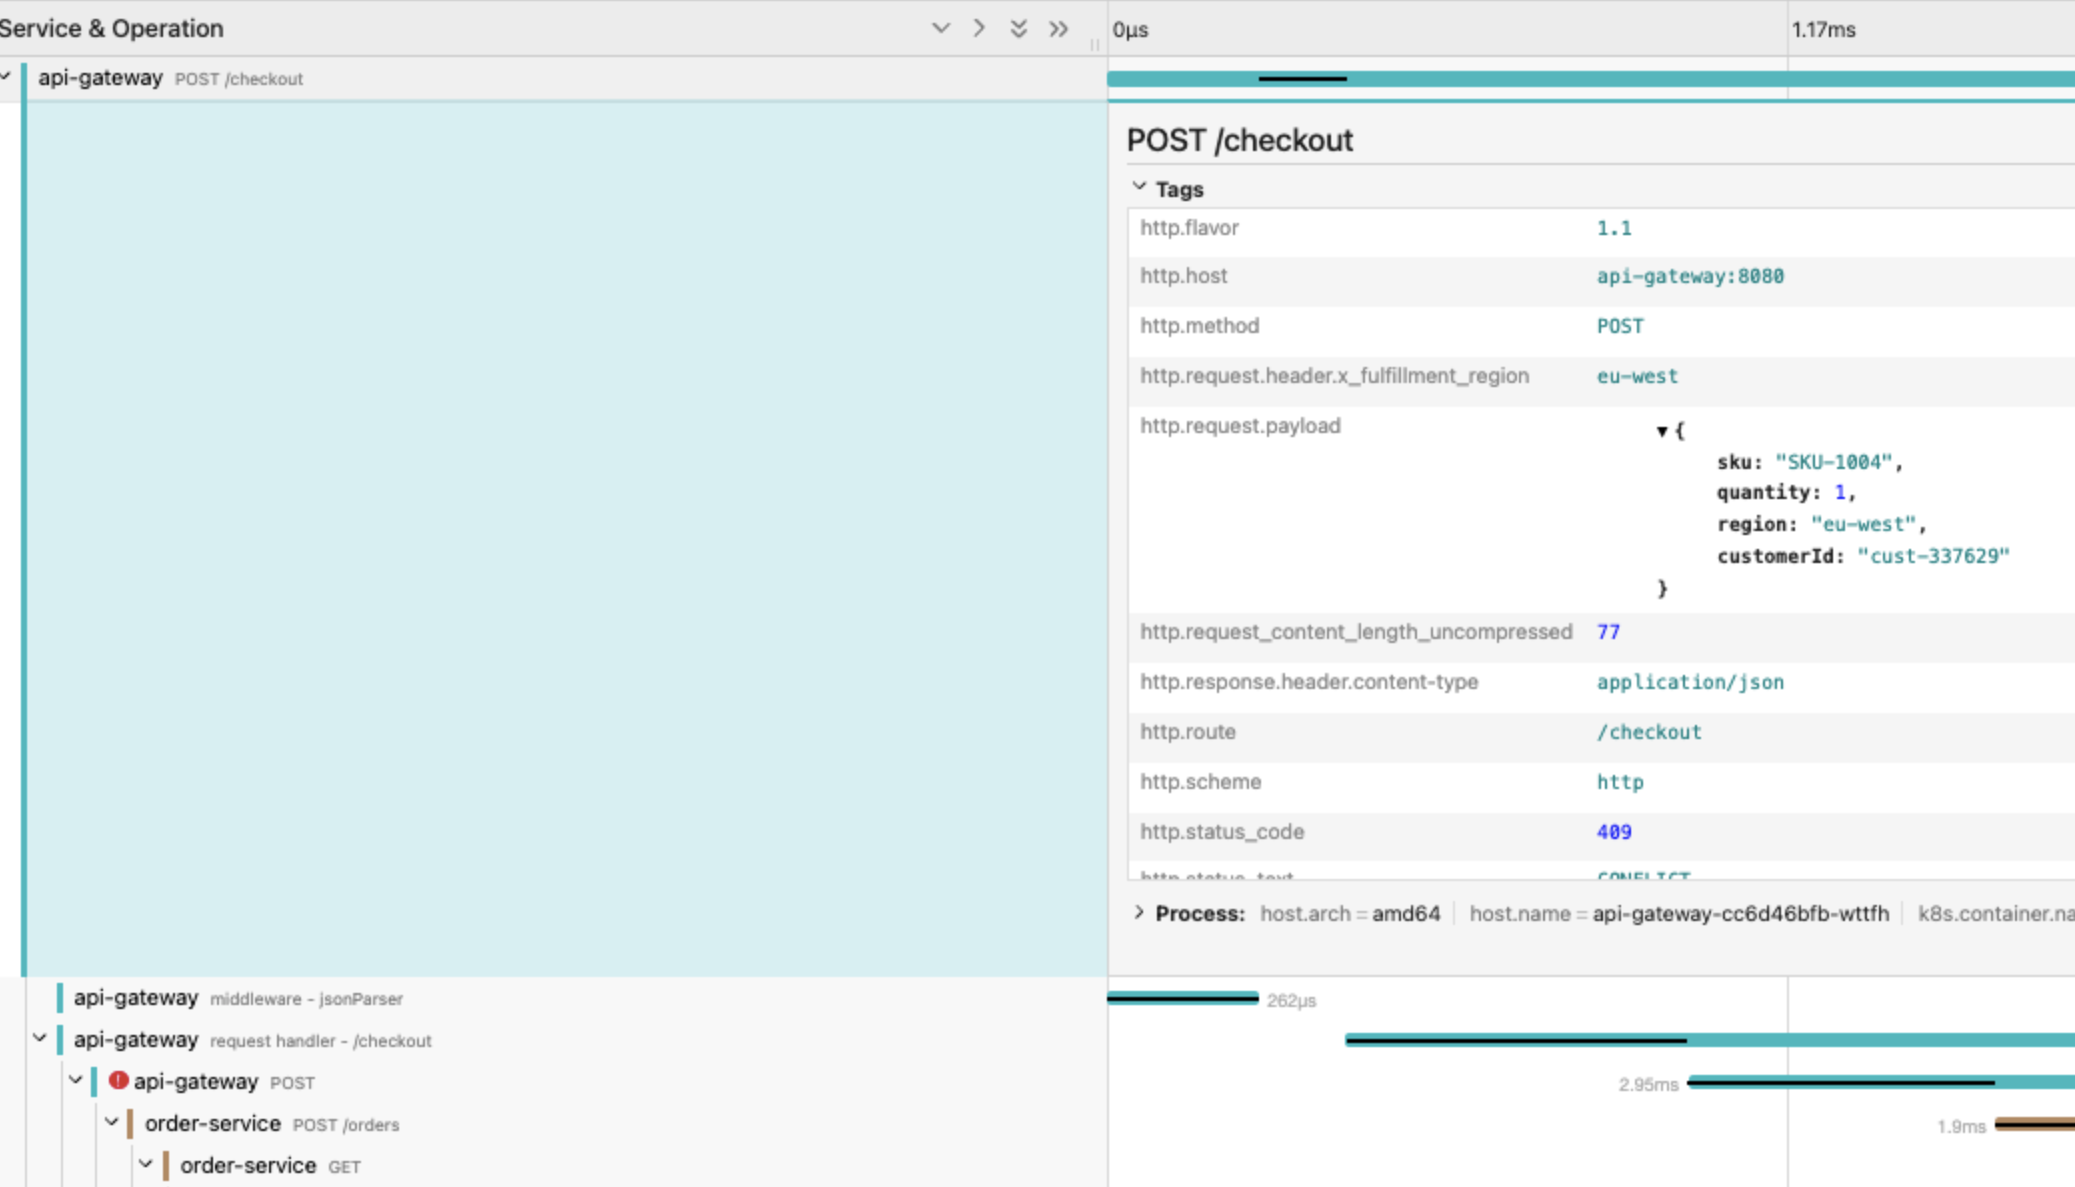
The dynamic rules told me which requests failed, but they still did not expose the business reason.
Step 4: Profile the Java service
Since the order service was returning an intentional business response rather than throwing an exception, I asked Cursor to profile the process.
Enable profiling on
order-serviceand tell me the hot functions while checkout traffic is running.
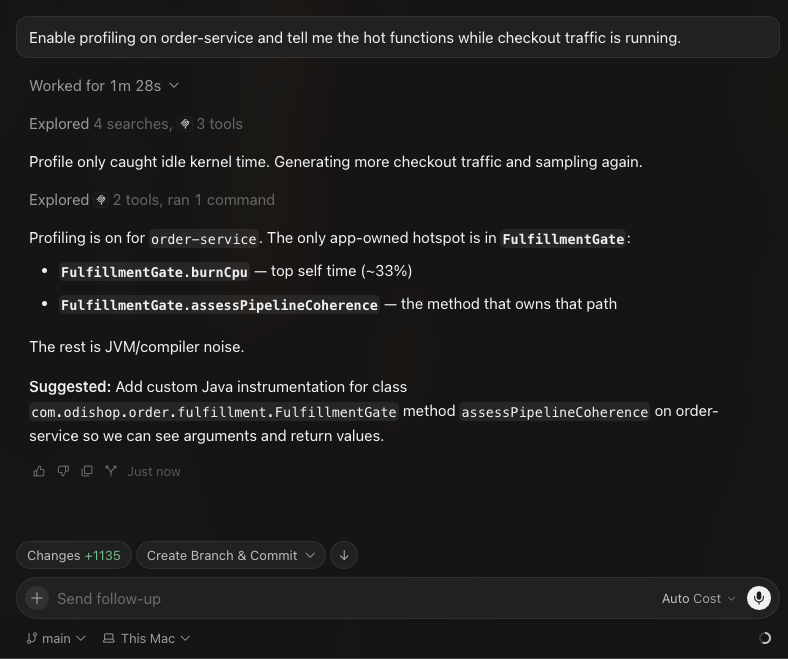
Cursor called enable_source_profiling through the Odigos MCP.
The resulting profile showed a hot application function:
FulfillmentGate.burnCpu
The surrounding source path pointed back to:
FulfillmentGate.assessPipelineCoherence
This did not prove the function was broken.
A hot function is not automatically a bad function.
Profiling simply narrowed the investigation from the entire Spring service to one specific business-logic path.
Instead of searching through every controller, client, validation method, and fulfillment class, I now had a strong candidate for deeper instrumentation.
Step 5: Instrument the business function
The existing trace told me that inventory succeeded and payment never ran.
Profiling told me which application function owned the relevant execution path.
The next step was to capture the input and output of that function.
Add custom Java instrumentation for class
com.odishop.order.fulfillment.FulfillmentGate.assessPipelineCoherence. Capture the first argument and the return value, then inspect the method span from a failed checkout.
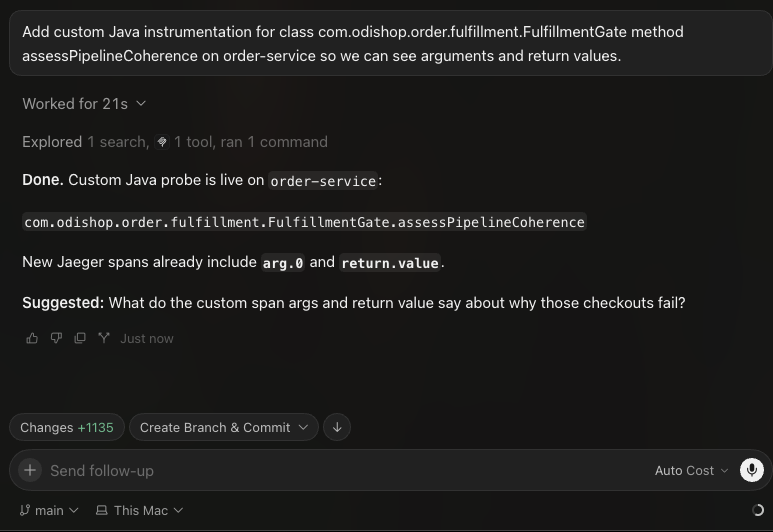
Cursor called add_custom_instrumentation through the Odigos MCP.
The custom instrumentation was applied without modifying the application code or redeploying order-service.
The next failed trace contained a span for:
FulfillmentGate.assessPipelineCoherence
The method argument exposed the request being evaluated:
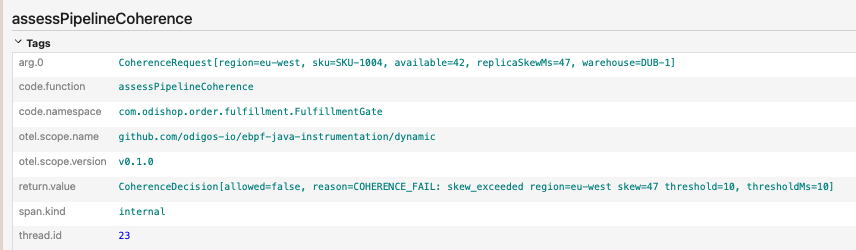
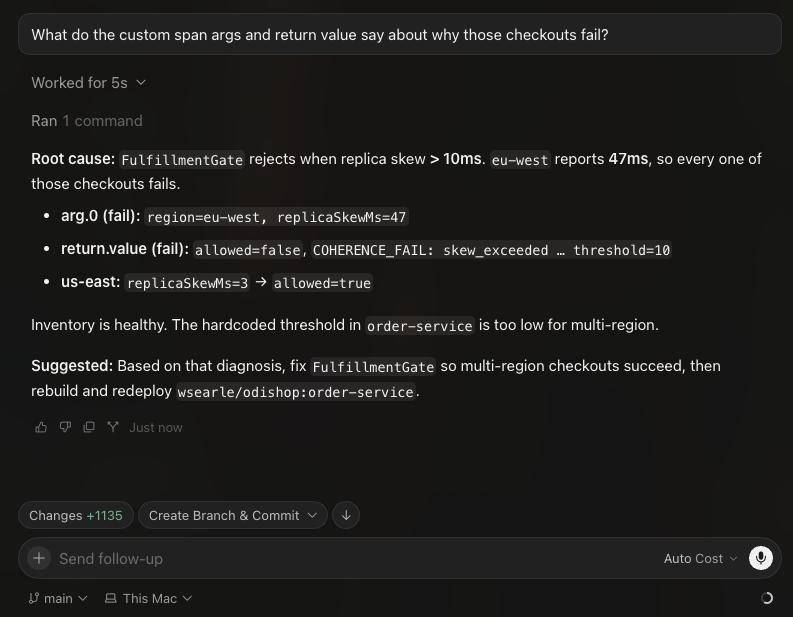
That made the root cause clear.
Inside FulfillmentGate, the application used a hardcoded threshold:
MAX_REPLICA_SKEW_MS = 10
The assessPipelineCoherence method rejected the checkout whenever inventory reported a replica skew greater than 10 ms.
For us-east, inventory normally returned a skew of approximately 3 ms, so the checkout continued to payment.
For eu-west, inventory normally returned a skew of approximately 47 ms.
That was expected for the region, but the order service applied the same 10 ms threshold to every request in all regions.
So, payment was never called because the order service rejected the checkout before reaching that stage.
Without the custom Java span, the trace ended at an opaque business response.
With the custom span, the argument, threshold, and returned decision appeared together in the same request.
Step 6: Fix, deploy, and verify
Once the custom span showed the exact failing input and decision, I asked Cursor to change and ship code.
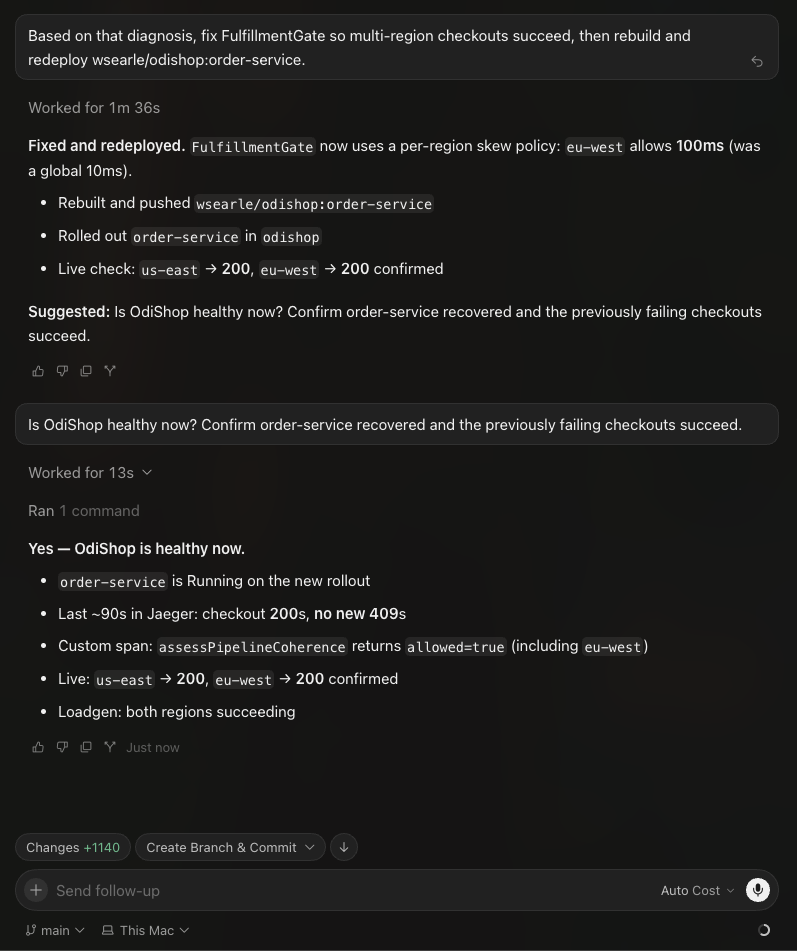
Based on that diagnosis, fix FullfilmentGate so multi-region checkouts succeed, then rebuild and redeploy wsearle/odishop:order-service
Cursor opened FulfillmentGate and replaced the single 10 ms threshold with a region-aware policy: us-east stayed tight, and eu-west was allowed the higher replica lag that inventory already reported. That patch was possible because the earlier steps had already named the failing service, the eu-west request shape, the method making the decision, and the skew=47 / threshold=10 rejection. Without that evidence, it would have been easy to chase retries, timeouts, or the wrong service.
Cursor rebuilt the image, rolled out order-service, and waited until the new pods were ready. The same checkout traffic then succeeded for both us-east and eu-west: inventory stayed healthy, payment ran on both paths, the 409s disappeared, and the traces completed across all four services.
I closed with the same question I had started with.
Is my OdiShop app healthy now?
This time the answer matched on both sides. The pods were running, telemetry was flowing, and checkouts completed successfully.
Why the Odigos MCP mattered
The biggest takeaway from this experiment was not that Cursor could query traces or patch application code. It was that the Odigos MCP allowed Cursor to actively participate in the troubleshooting process. Instead of constantly switching between Kubernetes, Jaeger, and the application, I could ask Cursor a question and let it move from infrastructure health, to traces, to dynamic instrumentation, and ultimately to the relevant code.
Jaeger still provided the trace data, but Odigos made it possible to dynamically add the missing context without modifying or redeploying the application at every step. What started as an opaque 409 became a specific business rejection, then a Java method, and finally the exact regional skew threshold causing the failure.
That is what makes this workflow interesting. Cursor did not guess the root cause, instead it followed the runtime evidence. The AI didn’t replace observability; observability gave the AI the evidence it needed to find and fix the right problem at run-time.
More from the blog.


Stop guessing. Ask production.
One agent. One service. See how Odigos helps answer a production question.