
Odigos Go Enterprise: The Future of Go Observability
The future of Go Observability using Odigos Enterprise Instrumentation

Here are 6 things you can only do with Odigos
Go applications are exploding with our customers. It’s fast, efficient, and perfect for infra and backend systems. But once it’s compiled and running in production, good luck figuring out what is actually happening inside. Traditional instrumentation? Requires code changes, redeploys, and most customers still have many gaps and blindspots.
We built Go support in Odigos the way it should work: no agents, no SDKs, no code changes. Just clean, dynamic tracing with eBPF - including full context propagation and visibility into high cardinality data.
Here are 6 things you can only do with Odigos Enterprise for Go:
1. SSL/TLS Visibility: See Encrypted Traffic Clearly. This is a crucial differentiator. Unlike many network-level eBPF tracers that operate at the system call level, Odigos instruments via uProbes. This means we capture data before encryption occurs for outbound traffic and after decryption for inbound traffic. This unique approach provides complete visibility into encrypted communication, giving you critical insights that traditional system-level eBPF programs simply cannot offer.
2. Deeper Context Propagation. Go applications often involve complex interactions. Odigos Enterprise goes far beyond standard HTTP and gRPC context propagation, covering a much wider array of use cases. This includes robust support for frameworks like Gin HTTP, ensuring you have complete visibility across your service calls.
3. Expanded Database Coverage. Understanding database interactions is critical for debugging and performance optimization. Odigos Enterprise extends context and captures high-cardinality data not just for standard SQL, but also for GoSQL, Elasticsearch, and PostgreSQL, giving you a more holistic view of your data layer.
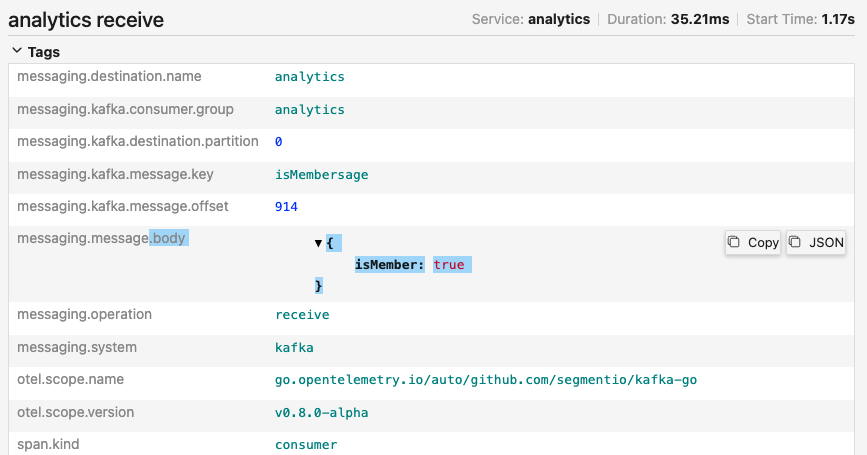
4. Comprehensive Messaging Instrumentation: Beyond Kafka. While OpenTelemetry's automatic instrumentation for Go offers Kafka support, Odigos Enterprise significantly expands your visibility into messaging systems. We provide advanced instrumentation into message protocols and even payloads for RabbitMQ, Pulsar Client, and IBM Sarama, in addition to robust Kafka coverage. This ensures you have deep insights across all your critical message queues, not just a subset.
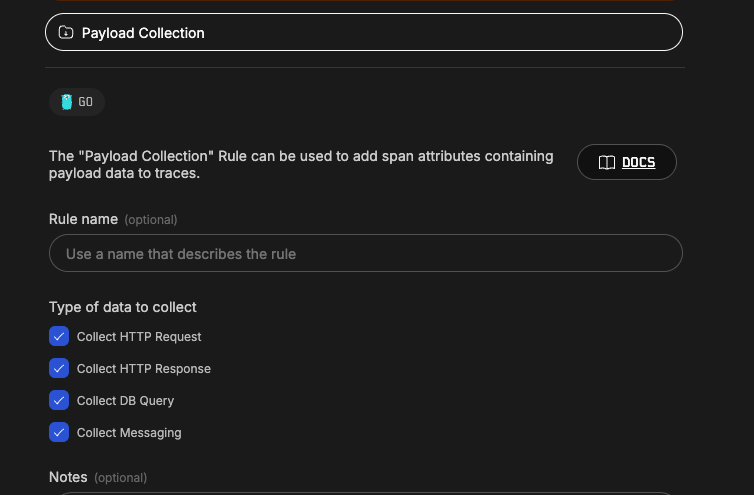
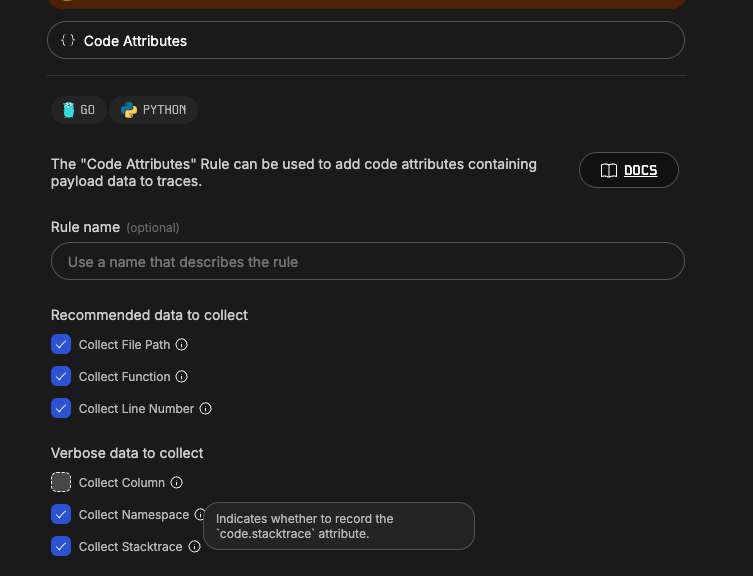
5. Dynamic Instrumentation Rules: Observe on Demand. This is a game-changer. Odigos empowers you to dynamically turn instrumentation on and off live, without requiring any restarts. Whether you need to enable/disable specific attributes, messaging insights, or query details, Odigos provides the flexibility. Furthermore, you can instantly toggle code attributes like stack traces and line numbers for easier debugging precisely when you need them, and then turn them off when you don't.
6. Live Go Custom Instrumentation – Unlocking Business Insights (Coming Soon). Imagine being able to dynamically instrument specific methods, capturing their arguments and return values on the fly. This upcoming feature in Odigos Go Enterprise will be incredibly powerful, giving you the ability to gain precise, real-time business data directly from your application's execution path.
Odigos Enterprise is designed for organizations that demand deep, flexible, and non-intrusive observability for their Go and many languages. By leveraging eBPF and intelligent instrumentation, we empower you to get the insights you need, when you need them, without compromising performance or requiring extensive code modifications. If you want to start a trial of Odigos Enterprise send an email to trial@odigos.io
More from the blog.



Stop guessing. Ask production.
One agent. One service. See how Odigos helps answer a production question.