
Solving the Pitfalls of Distributed Tracing in Real-World Microservices
Learn why distributed tracing often fails in production and how to fix common issues like missing traces, broken context, and performance overhead.
Solving the Pitfalls of Distributed Tracing in Real-World Microservices
Distributed tracing is supposed to be the ultimate debugging tool for microservices. The idea is simple: every request carries a trace ID, giving you a clear, end-to-end view of what happens inside your system.
The Promise vs. The Reality
When something breaks, tracing should tell you exactly where and why. But in reality? Tracing often fails at the moment you need it most.
- Spans go missing
- Trace context breaks
- Observability overhead slows everything down
- Configuration becomes a nightmare
- Vendor lock-in makes you regret your choices
Instead of a clean, searchable history of system behavior, you end up with fragments of data, gaps in visibility, and a growing sense of frustration.
The result? More time spent troubleshooting than actually fixing issues.
Let’s break down why tracing fails-and how to fix it.
Broken Trace Context: The Silent Killer
A request should carry a trace ID across every microservice, ensuring a complete picture of its journey. But when a service drops the trace ID, everything falls apart. Tracing is only as strong as its weakest link.
The Hidden Complexity of Trace Propagation
Most teams assume that enabling tracing is enough. The reality? Not every service handles trace context the same way. Some pass trace headers as expected, while others strip them out due to outdated libraries, missing configurations, or third-party limitations. This inconsistency leaves gaps in traces, making debugging far harder than it should be.
Why Trace Context Breaks
| Cause | Impact |
|---|---|
| Inconsistent adoption across teams | Some services propagate traces correctly while others don't, creating gaps in observability. |
| Third-party APIs and legacy systems | External services may not support tracing headers, breaking trace continuity. |
| Framework-specific trace handling | Different tracing libraries and frameworks handle context propagation inconsistently. |
Example: The Vanishing Order
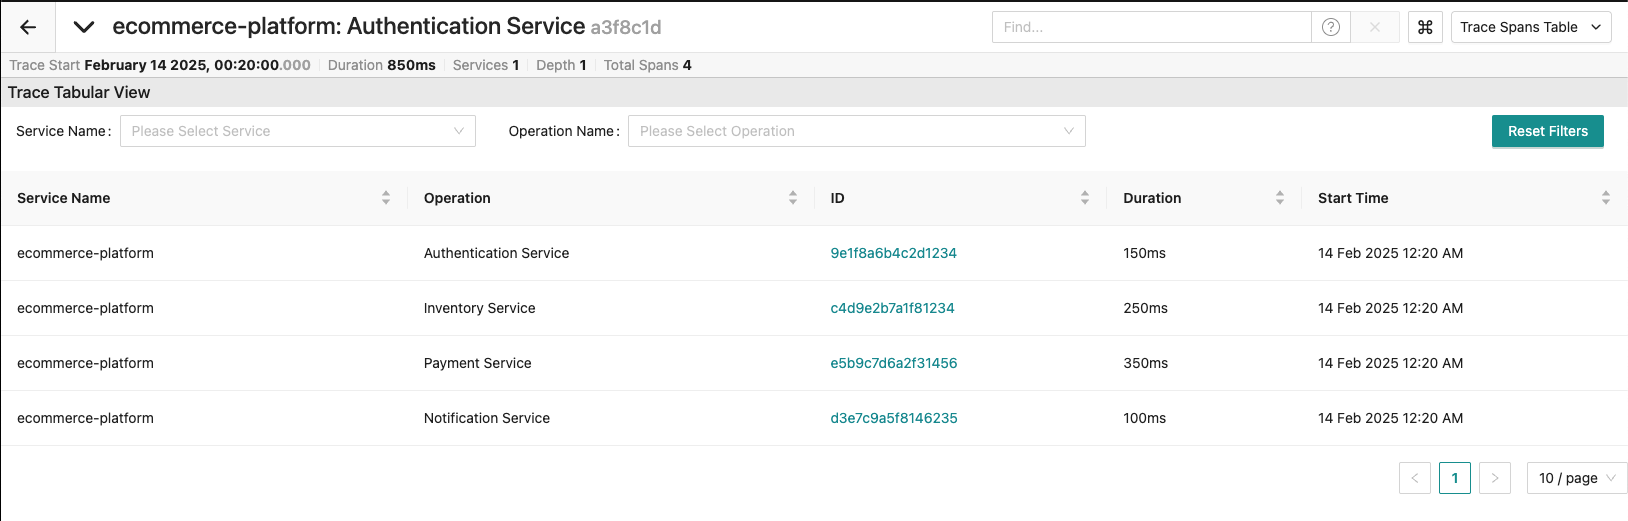
An e-commerce customer places an order. The request flows through authentication, inventory, payment, and notifications. But somewhere along the way, a service drops the trace context. Now the engineering team can't see if the issue is in the payment gateway, the inventory sync, or the order confirmation service. Debugging takes twice as long, delaying resolution and frustrating customers.
How to Fix It
- Use W3C Trace Context. Standardize how trace propagation works across services.
- Automate trace injection. Every service should include trace headers without manual effort.
- Test trace continuity before production. Don't wait until an outage to find out it's broken.
The Black Box Problem: Missing Traces in Databases and Internal Services
Even when trace context is handled correctly between services, there's another major blind spot: tracing what happens inside databases, caches, and internal services that don't expose trace data.
Why Internal Systems Are Hard to Trace
| Hidden Component | Challenge |
|---|---|
| Databases | SQL queries, transactions, and locks don't always produce traceable events. |
| Message Queues | Background processing disconnects operations from real-time tracing. |
| Serverless Functions | Stateless execution makes correlating traces across invocations difficult. |
Example: The Mystery Latency
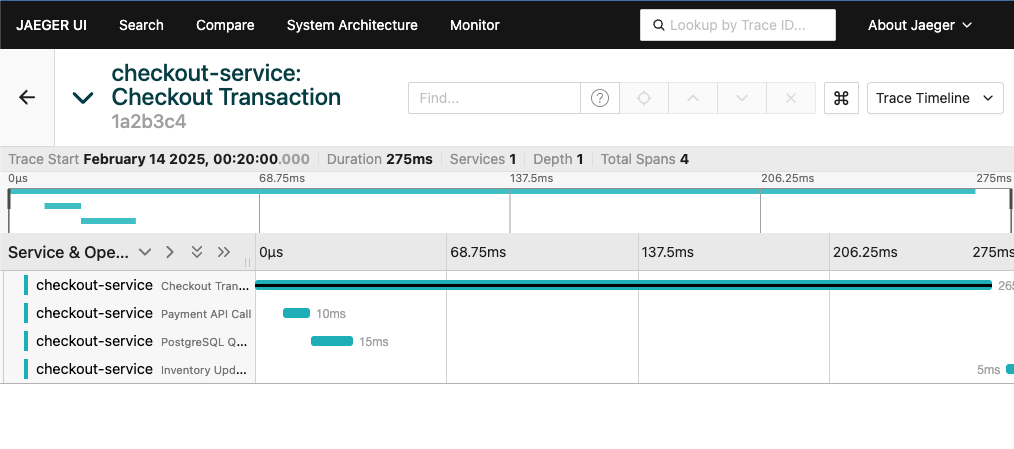
A SaaS platform experiences unpredictable slowdowns. Traces show requests moving smoothly between services-until they reach the database. After that, the trace just stops. There's no visibility into query performance, lock contention, or slow transactions. Engineers suspect the database is the bottleneck, but without detailed traces, they're flying blind.
Why This Matters
Microservices don't operate in a vacuum. If you can't trace what's happening inside your database, queue, or serverless environment, you're missing half the picture. Finding performance issues in these systems often requires guesswork, which defeats the entire purpose of distributed tracing.
Performance Overhead: When Tracing Slows You Down
Tracing generates a ton of data-too much if you're not careful. In high-traffic systems, capturing every request can crush performance.
The Balancing Act: Visibility vs. Performance
Every trace carries overhead. Too much tracing slows things down, while too little leaves teams blind. Finding the right balance is key. Teams often resort to either reducing trace volume (risking gaps in data) or turning off tracing in production (defeating the purpose entirely).
The Trade-offs Teams Face
| Approach | Impact |
|---|---|
| Full tracing | Great visibility but adds latency and resource usage. |
| Selective tracing | Reduces overhead but loses critical insights. |
| No tracing | Eliminates performance issues but removes observability. |
Example: The Debugging Bottleneck
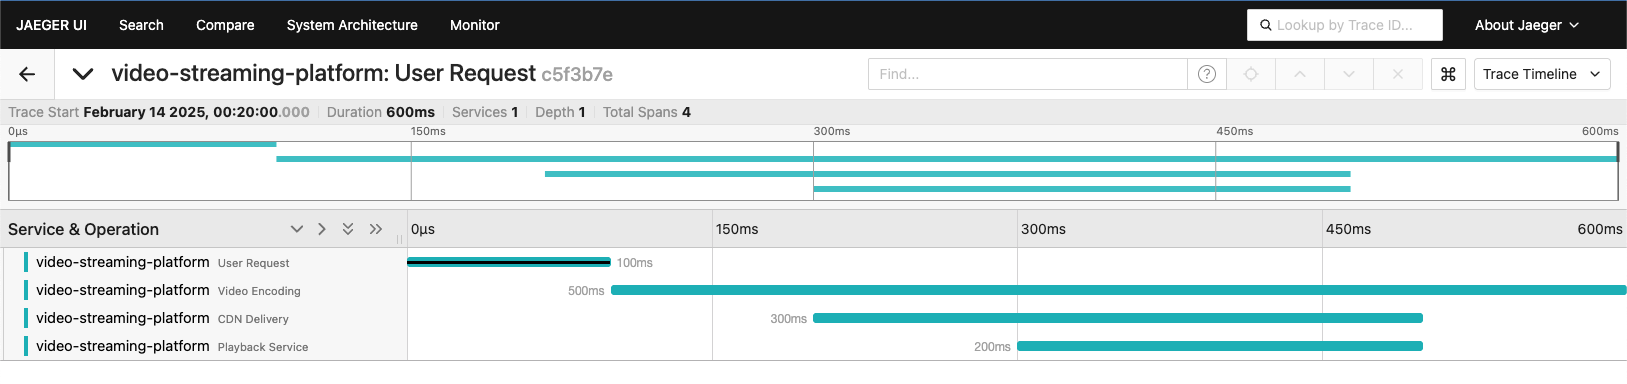
A video streaming platform enables full tracing in development but scales it back in production to avoid CPU spikes. Then, a high-profile outage happens. With key traces missing, the team spends 30% more time debugging, delaying fixes and costing the company thousands in lost revenue.
Our dev environment shows the detail level which is ideal. The team tried the same but at the volume of production they were worried about performance overhead and the cost of storage with this much granularity at scale..
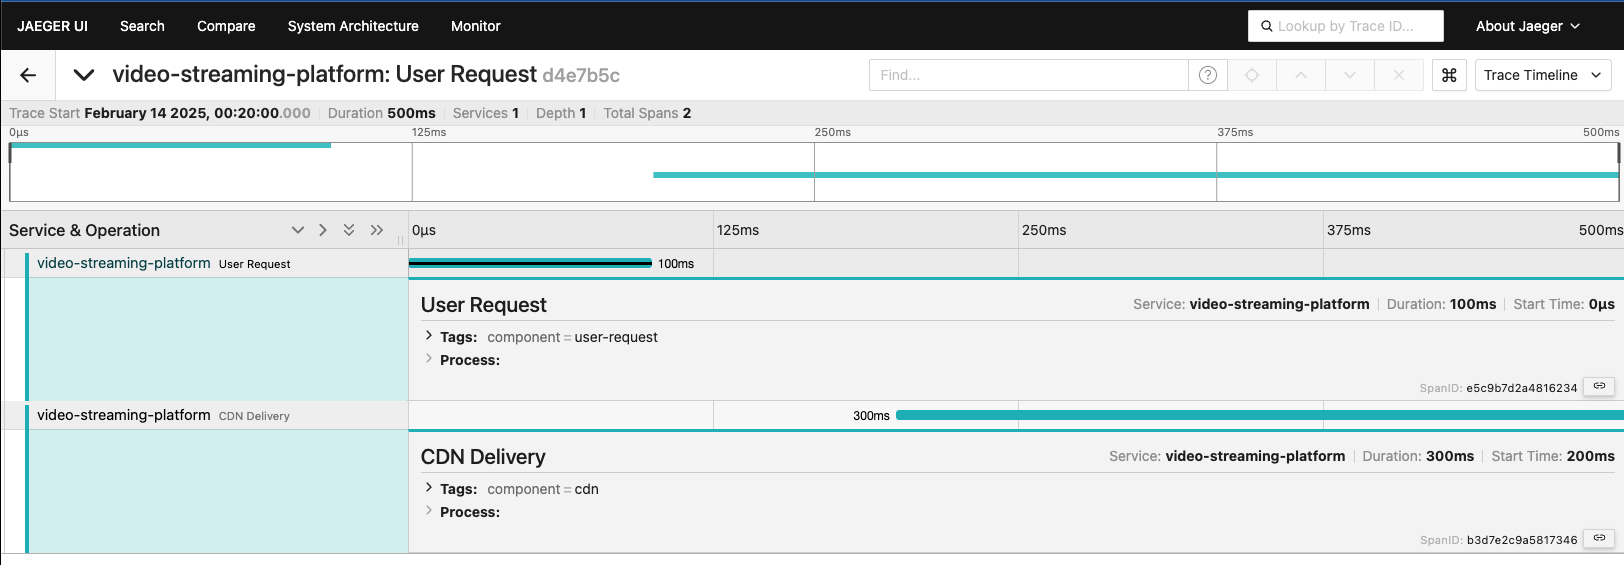
Now, look at the same transaction in production. This saves on tracing overhead but leaves gaps in the span which creates blind spots.
How to Fix It
- Adaptive sampling. Capture only the most valuable traces.
- eBPF-based tracing. Collect telemetry at the kernel level without impacting app performance.
- Efficient data storage. Route less critical traces to long-term storage.
service:
  pipelines:
    traces:
      receivers: [otlp]
      processors: [tail_sampling]
      exporters: [jaeger, logging]
OpenTelemetry config options can help you to control your sampling and storage, keeping performance intact. That said, flexibility also means configuration challenges which is why distributed tracing is still a struggle to optimize how you instrument your applications.
Stop Wrestling with Tracing
Distributed tracing was meant to improve observability, but for many teams, it just creates more headaches.
eBPF, OpenTelemetry, and zero-code instrumentation remove the complexity, making tracing practical and scalable.
Tired of missing spans? There's a better way.
Try Odigos and get distributed tracing that just works.
More from the blog.



Stop guessing. Ask production.
One agent. One service. See how Odigos helps answer a production question.