
Seeing is Believing: Session Replays Meet Distributed Tracing
Stitching together session replays with backend traces using Odigos and HyperDX Browser SDK
Seeing Is Believing: Session Replays Meet Distributed Tracing
When debugging production issues, developers often wish they could see what the user saw. That’s the promise of session replays: a visual recording of the browser session that shows clicks, page loads, errors, and console logs as they happened.
Session replays alone are powerful, it takes the guesswork out of reproducing UI bugs. But what if you could connect those replays to your backend traces, so that a button click not only shows up visually but also ties directly to the API calls, database queries, and downstream services it triggered?
That’s exactly what I set out to do: combine HyperDX session replays with Odigos-instrumented traces on Kubernetes services. The result is a seamless view, where user actions and backend spans live in a single trace.
Why Combine Session Replays and Traces?
Session replays answer what the user did, while tracing answers what the system did...
When combined, you can see the user’s exact interaction like clicks, errors, and navigation, and follow the interaction into your backend services like Node, Java, databases, etc. correlating frontend frustration with backend bottlenecks in real time. This level of visibility drastically improves MTTR. Rather than contending with the familiar challenge of reproducing issues locally, teams can now observe both the user interface and the corresponding trace seamlessly integrated in a single view. Let’s walk through how I built it.
The Demo App
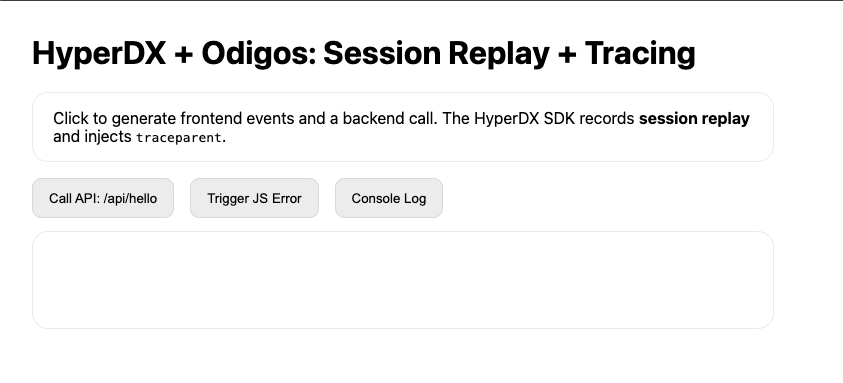
To demonstrate this integration, I built a simple three-service application on EKS:
- Frontend Pod: static HTML + HyperDX Browser SDK (session replay + trace propagation).
- API Pod (Node.js): Express server that handles /api/hello and calls the worker.
- Worker Pod (Java): lightweight service that simulates some work and returns JSON.
Odigos automatically instruments the Node API and Java Worker pods, so I get eBPF powered traces without touching the code. The frontend only needs the HyperDX SDK snippet to start sending replays and injecting traceparent headers.
Step 1: Deploy The Services
After setting up an ingress on EKS, I built a simple three-service application consisting of a frontend, an API, and a worker. Each service was containerized and deployed to Kubernetes, with the frontend configured to serve a static HTML page. This HTML page included a config.js file generated from a Kubernetes Secret containing the HyperDX API key. Inside the index.html, I loaded the HyperDX Browser SDK dynamically and initialized it with my API key, service name, and environment. Doing this enables session replays and trace propagation, so any request to /api would automatically include the proper W3C traceparent header. This ensured that user interactions captured in the browser could be linked directly with backend spans collected by Odigos, enabling the seamless stitching of frontend session replays and distributed traces into a single end-to-end view. Here is the snippet from my frontend service for reference:
<script src="/config.js"></script>
<script src="https://cdn.jsdelivr.net/npm/@hyperdx/browser/dist/bundle.min.js"></script>
<script>
  (function () {
    var sdk = window.HDX || window.HyperDX;
    if (!sdk) { console.error("HyperDX SDK not loaded"); return; }
    sdk.init({
      apiKey: window.__HYPERDX_API_KEY__,
      service: "demo-frontend",
      environment: "dev",
      enableSessionReplay: true,
      tracePropagationTargets: [/\/api/i]
    });
    console.log("HyperDX initialized");
  })();
</script>
More information on configuring the HyperDX Browser SDK can be found here
Step 2: Instrument Backend Services with Odigos
With Odigos installed, instrumenting the backend was only a matter of selecting the pods in the Odigos UI:
- demo-api (Node.js)
- demo-worker (Java)
Then I added a Destination pointing to HyperDX Cloud with my API Token. Odigos automatically instrumented my apps (without code changes nor restarts) using eBPF and sent traces into HyperDX.
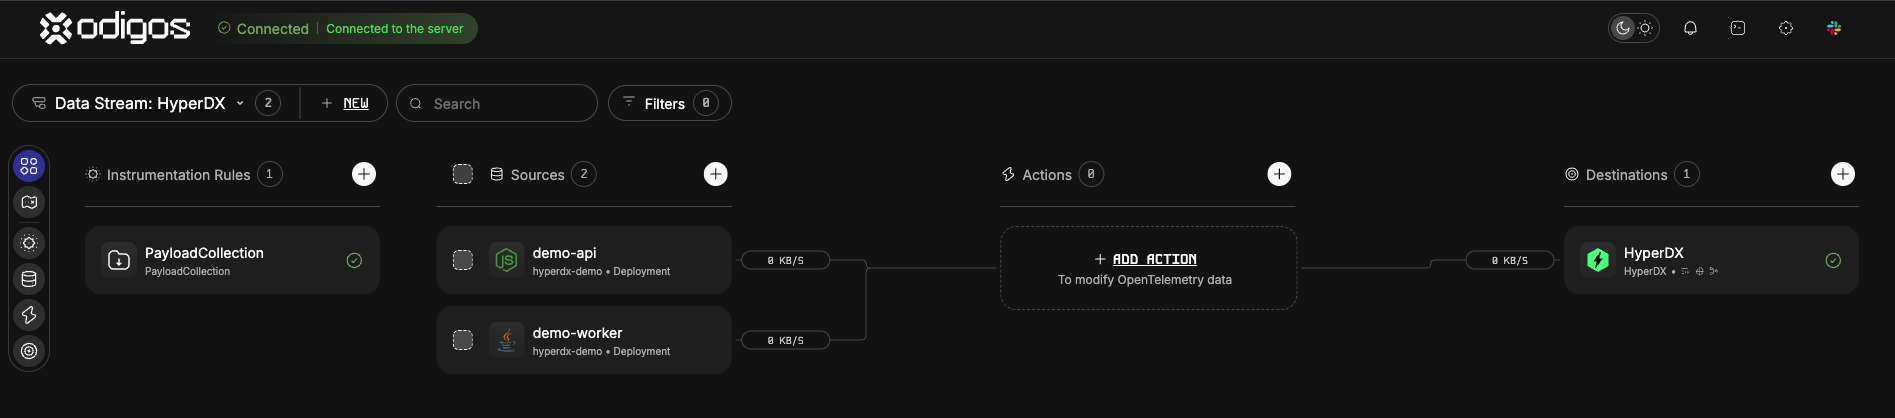
This is where Odigos shines. Because Odigos leverages eBPF, it can capture richer and fuller traces than traditional agents ever could. You’re not limited to what a developer remembered to wrap with instrumentation, nor are you limited to the boundaries of bytecode instrumentation. Odigos observes activity at the kernel level, surfacing library-level requests, runtime behavior, and service interactions automatically. Combined with the fact that Odigos outputs pure OpenTelemetry, it becomes the perfect partner for HyperDX Browser SDK. Frontend session replays flow into backend traces without any "glue code," giving you an end-to-end observability story with almost no friction.
Step 3: Generate Load
Once the application was up and running, I opened the frontend URL and clicked the Call API: /api/hello button. In the browser console we could immediately see the confirmation message HyperDX initialized, while in the UI the API responded with JSON that included output from the Java worker. Most importantly, in the HyperDX Cloud interface this single action produced a unified trace containing all three spans:
- The browser span with the full session replay
- The Node API span from the demo-api service
- The Java worker span from the demo-worker service
The Session Replay...with my erratic mouse movement :)
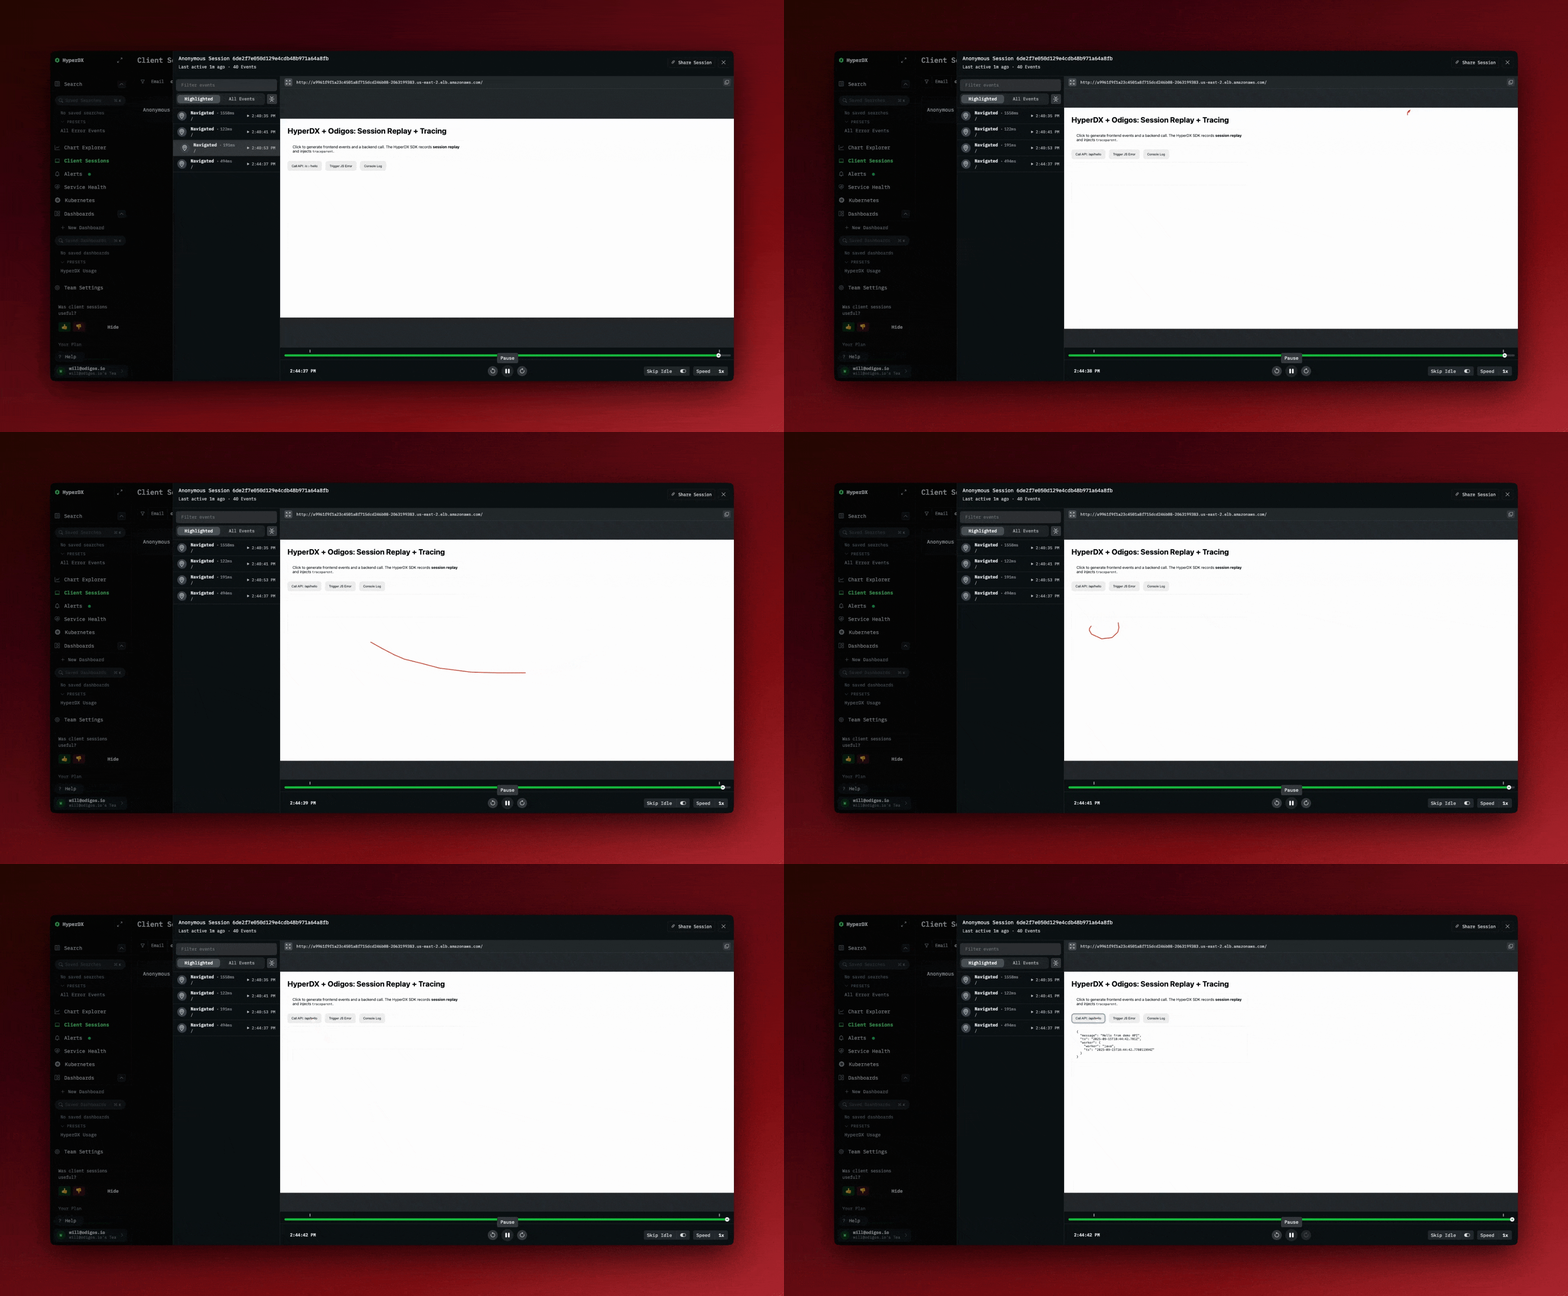
The Associated Backend Trace...IN THE SAME VIEW!
The Payoff: End-to-End Visbility
The real payoff of this integration is the kind of end-to-end visibility most teams only dream about. In a single view we were able to watch exactly what the user did in the browser, then follow that action seamlessly through the Node API and into the Java worker, with every span tied together under the same trace. That means no more guesswork, no more endless log-diving, and no more finger-pointing among teams. You can jump straight from a click in the UI to the backend call that handled it and understand precisely why things behaved the way they did. Session replay tells you what happened and tracing tells you why it happened, but when you combine them, you unlock full-stack observability that transforms debugging into understanding and elevates monitoring into a true picture of user experience.
More from the blog.



Stop guessing. Ask production.
One agent. One service. See how Odigos helps answer a production question.