
Resource Detection: The first step to enriching observability
Resource detection is a key step in adding business context to tracing in OpenTelemetry.
What is Resource Detection?
In application observability, context is key. Not only in terms of context propagation, which is critical for distributed tracing to function, but also in terms of business context. As in, where do you signals originate from and what are they telling you about your application? What host is causing that high latency request, or which cluster is leading to that spike in error responses?
These questions are answered in OpenTelemetry with
Resource Attributes. Backed by
Semantic Conventions, attributes such as host.name and k8s.deployment.uid offer
key insights into exactly which resource is responsible for which signal. There are
even vendor-specific attributes, for example cluster name and region depending on your
cloud provider.
Without these attributes, most telemetry would be effectively useless. So how do you ensure these details are available in every span, every time?
At first, it may seem trivial to manually inject details like "cluster name". It is possible
to set resource attributes through OpenTelemetry SDKs and environment variables. But
consider inherently dynamic attributes such as k8s.pod.name or the possibility of
migrating to a new cloud provider (and therefore a new cloud.region). To be effective
at scale, resource detection needs to be automatic.
Automatic Resource Detection with OpenTelemetry
Perhaps the easiest way to get automatic resource detection is to use the resource detection processor for the OpenTelemetry Collector. This processor contains contributed resource detection plugins for many popular vendors including AWS, Azure, GKE, Heroku, OpenShift, and more. Each of these plugins is provided and maintained by the vendor to be compatible with their platform, usually using metadata APIs, allowing the Collector to gather rich details on the environment it's running in.
But in practice, using this processor optimally is often a little more complex than set it and forget it.
Resource Detection architecture
Within application observability it's generally best to perform enrichment as close
to the source of the data as possible. Doing so helps minimize the amount of processing
required in your pipeline and ensure the correct attribution of application details.
For example, if you can add k8s.pod.name within the pod itself, you relieve potential
backpressure from your Collector having to make Kubernetes API calls further down
your pipeline.
One way this looks in practice is in the diagram below:
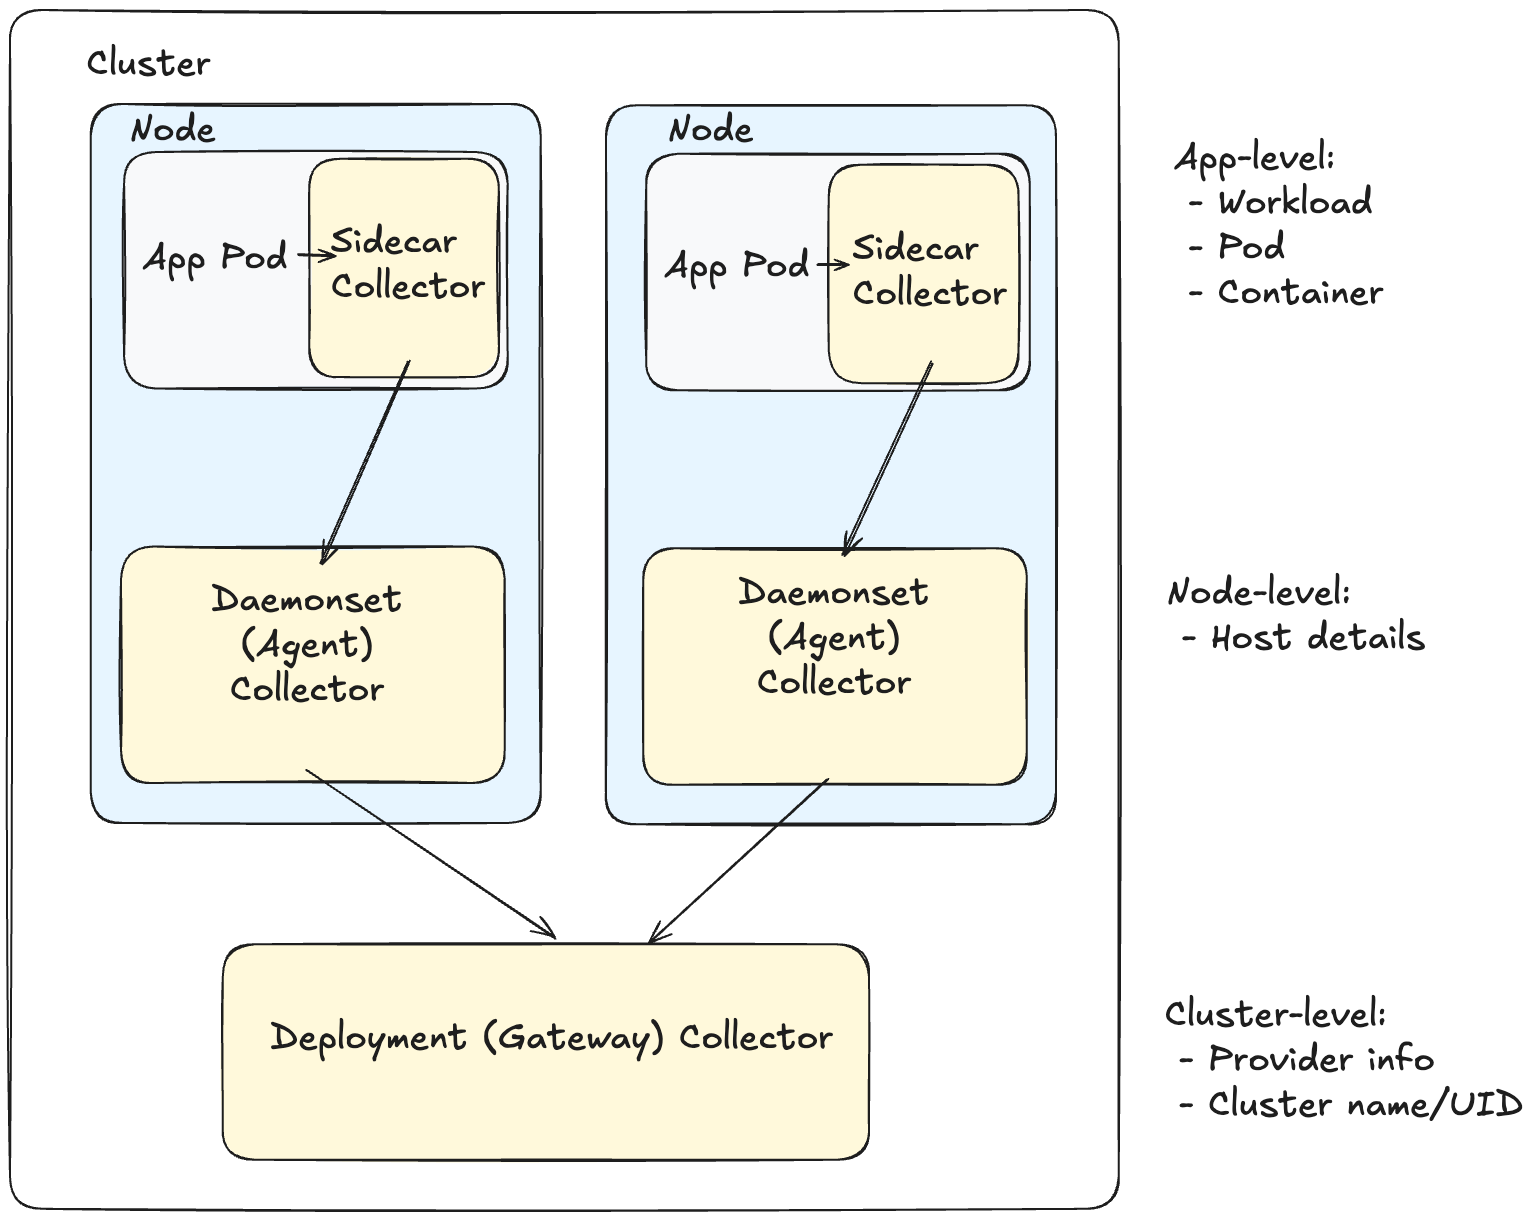
In this setup, there are three layers of Collectors working together:
- A Sidecar Collector gathering details about the individual applications such as pod name and container image.
- An Agent (Daemonset) Collector running on each node and gathering node-specific details such as the hostname and operating system.
- A Gateway Collector Deployment adding cloud provider info such as region and cluster name.
In theory, this is one of the optimal approaches to using Collector resource detection because it staggers the work each collector must do, reducing bottlenecks and the risk of dropped data further down the pipeline. It is also a necessity depending on which attributes you need, as once a signal leaves a level it can't be easily attributed to resources at that previous level anymore.
However, maintaining three separate Collectors (each with their own configuration and memory/cpu requirements) is not always practical and may in fact be a net hinderance at scale with many thousands of applications and nodes.
If that's the case, you can choose to either consolidate (starting with removing the sidecar Collector) or eliminate certain attributes completely based on your needs.
When Resource Detectors Fall Short
Automatic resource detection is not foolproof, and there are scenarios where relying on Collector detection alone is not convenient or even possible. An example of alternative resource attribution is with the Kubernetes attributes processor. This processor uses the Kubernetes API to identify the source pod for a data point and from that it enriches the data with higher-level resource info such as deployment, namespace, and node details.
But this processor comes with a cost in the resources required to maintain a cache of the cluster state, requiring careful architectural placement similar to the resource detection processor. As noted in the processor README, this processor can be scoped to a single node to reduce the high memory consumption of excessive and unnecessary Kubernetes API calls.
However, at Odigos we have seen that even this node-scoped approach doesn't always help with memory costs. Because resources like Deployments and ReplicaSets aren't bound to a single node, every agent instance of the processor must still maintain a cache of all of these resources in the cluster.
In large production clusters this is especially problematic when the Collector first starts up. This is because the processor's client relies on Kubernetes API informers, which perform an initial list of every relevant resource in the cluster at startup. The informer then must handle events from every update to these resources.
How Odigos Helps
The built-in Odigos OTLP pipeline includes resource detectors for GCP, AWS, and Azure out of the box. This means all of your cloud provider cluster info is available by default for apps instrumented with Odigos. We run these resource detectors as part of our agent-gateway Collector architecture. In our case, we run this detection at the node level both to provide host-level details as well as relieve memory requirements from our gateway Collector (the final destination through which all application telemetry flows out of Odigos).
For pod and container attributes, Odigos doesn't even need to rely on external resource detection. Instead, the relevant attributes are injected into your pods at the instrumentation itself via environment variables. This requires the least overhead with zero impact on your processing pipeline. Best of all, it's completely managed by the Odigos platform.
We also provide the Kubernetes attributes processor as its own Action to extract additional optional container-level attributes or custom Kubernetes label/annotation mappings to resource attributes.
Finally, for custom attributes Odigos Actions (such as Add Cluster Info) give you the ability to insert any attribute you need at the cluster scope.
In the end, resource detection is a cornerstone of reliable telemetry. While there is no true one-size-fits-all approach, Odigos makes it much easier to enrich your data in proven production-ready, scalable ways.
More from the blog.



Stop guessing. Ask production.
One agent. One service. See how Odigos helps answer a production question.