
Odigos Instrumentation Engines: Offering flexibility and choice in your observability approach
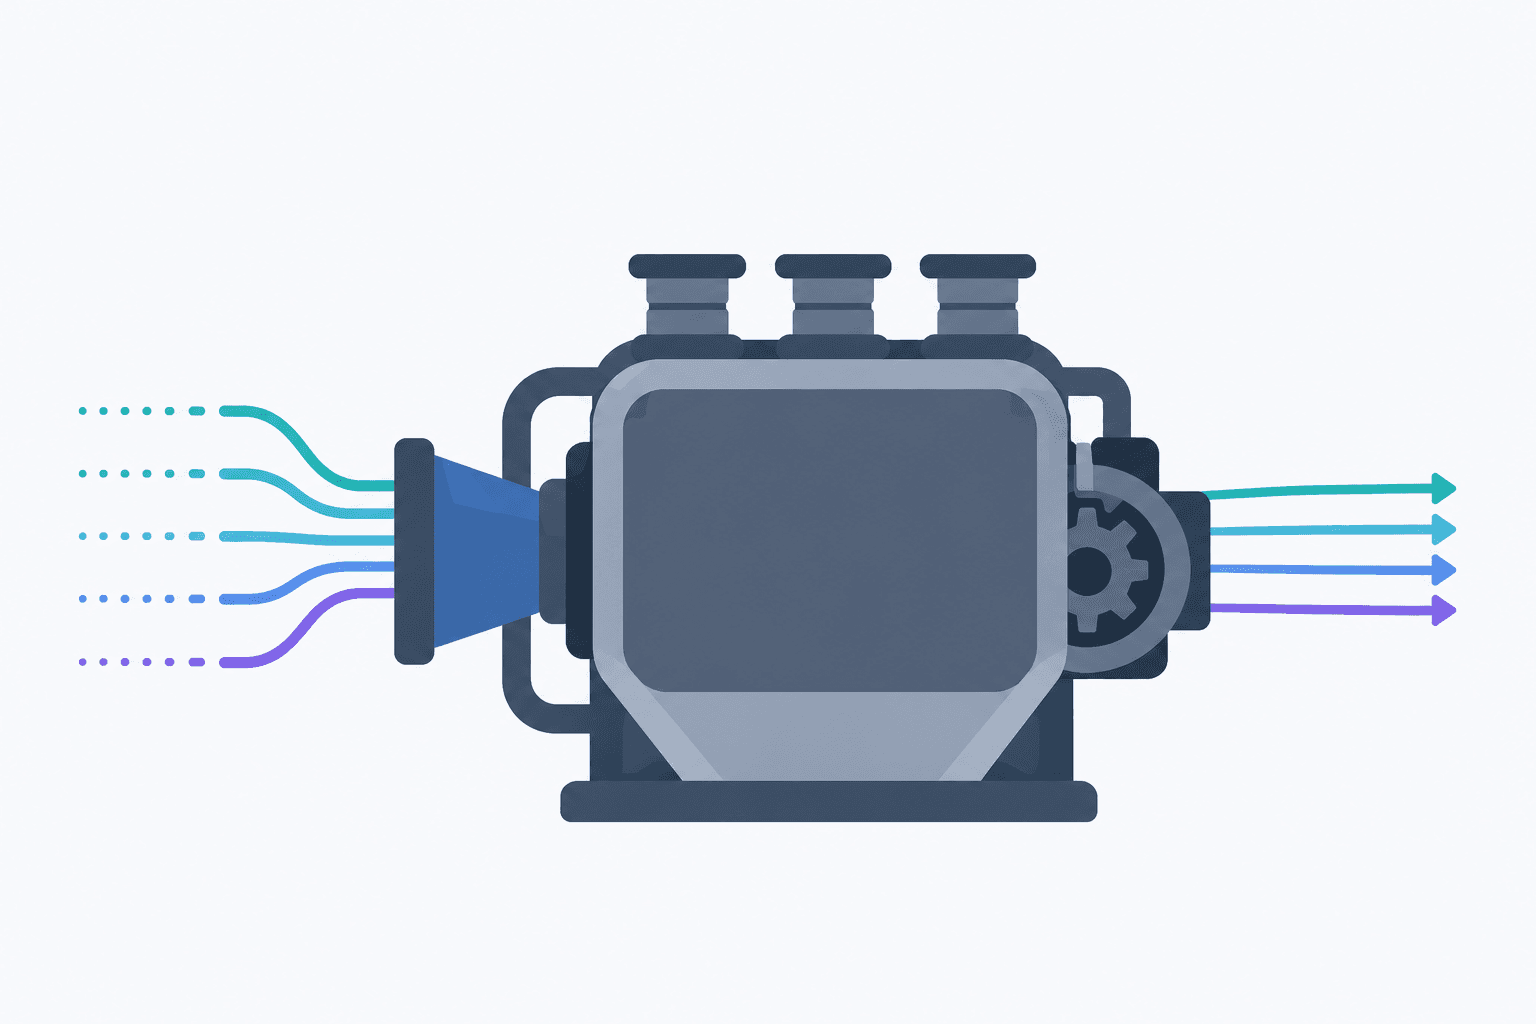
Observability requirements vary across applications, runtimes, and deployment environments. A single instrumentation approach rarely meets the needs of every workload.
Odigos provides a flexible instrumentation framework that allows organizations to choose the most appropriate instrumentation engine for each application. Our platform supports multiple approaches, including Odigos userspace eBPF instrumentation, OpenTelemetry eBPF Instrumentation (OBI), and OpenTelemetry language agents. This enables teams to instrument Kubernetes, VMs, and environments where eBPF is not available, such as managed serverless platforms.
By abstracting the instrumentation method behind a single platform, Odigos lets customers adopt the right technology for each workload while maintaining a consistent operational experience and OpenTelemetry-native telemetry across their environment.
Different layers to choose from
Instrumentation options each offer different benefits. Based on your application and environment, either Odigos eBPF, OBI, OTel Agents, or a combination can provide the best visibility.
-
Odigos eBPF provides deep instrumentation of userspace functions. This method is built on eBPF uprobes which allow Odigos to attach to application functions (including custom libraries). This is the most granular level of visibility into an application because it allows auto-instrumentation of real business logic, including specific method arguments and return values. That data is what enriches telemetry with the most semantically relevant attributes.
-
OpenTelemetry eBPF Instrumentation (OBI) is an open source project maintained by the OpenTelemetry community. OBI's approach focuses on eBPF syscall and network monitoring. This behavior emphasizes network flow visibility and language-agnostic instrumentation.
-
OpenTelemetry Agents are a non-eBPF approach which often rely on injecting auto-instrumentation into an application runtime, for example with Java bytecode instrumentation. The OpenTelemetry community maintains agents for many different languages, however each agent has its own language-specific deployment requirements and usually incur higher overhead than eBPF.
Below is a brief comparison of these approaches in Odigos:
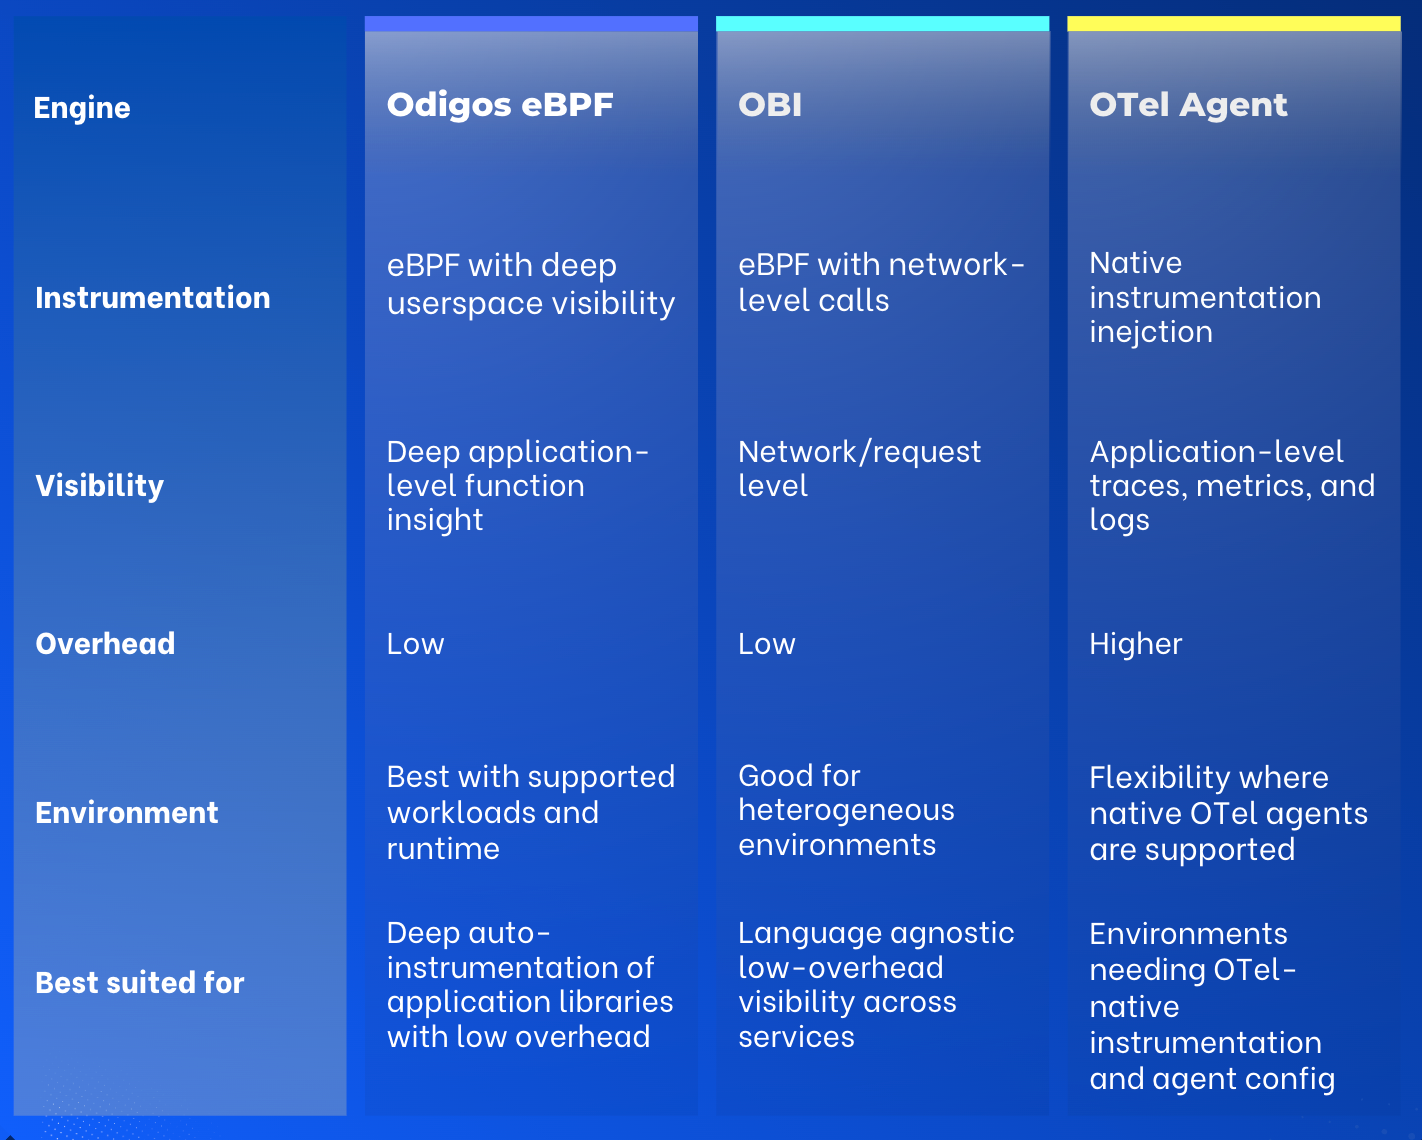
All of these engines are compatible thanks to the OpenTelemetry standard for telemetry data, meaning that it is safe to combine them as needed. Their main differences come from how they work, what they target, and the environments they can run in.
Which engine for you?
Deciding which engine fits best for your use case depends on multiple factors such as your language, environment, and overall observability needs, but regardless of the implementation the outcome is the same: OpenTelemetry standard data supported by any observability backend. While different instrumentation options may expose different logic and metadata, the goal is to optimize getting the most visibility with the highest relevance and the lowest burden.
More from the blog.



Stop guessing. Ask production.
One agent. One service. See how Odigos helps answer a production question.