
How Odigos Helps Debug Mysterious Delays in Microservices
Microservices architectures make debugging mysterious timeouts incredibly difficult. Odigos distributed tracing reveals the hidden connections between services and helps identify the root cause of cascading failures in Kubernetes environments.

Microservices architectures are powerful, but they come with a significant debugging challenge: when something goes wrong, it's often unclear which service is the culprit.
The Microservices Debugging Challenge
The challenge with microservices debugging is that problems don't respect service boundaries. In a microservices architecture running on Kubernetes, this kind of intermittent issue is particularly tricky because:
- Each service operates independently, making it hard to see the full request flow
- Problems in one service can cascade to others without clear cause-and-effect relationships
- Without proper observability tools, you're working with limited visibility into what's actually happening
The Cascade Effect
Here's a common scenario: you've got a microservice-based application running in separate pods across your Kubernetes cluster. Everything appears to be working fine - most API calls are completing within expected timeframes. But then you start getting intermittent timeouts that seem to happen randomly.
The problem occurs when some services need the same database table data. When one service holds a database lock, it blocks other services from accessing the same data, causing timeouts in completely unrelated services that wait for query data from the same database.
This creates a cascade effect where a single database lock affects multiple services:
- The service that triggered the lock - this one is obvious
- Other services waiting for the same database table - this is where it gets complex
- The frontend service waiting for responses - now users experience errors
All of this happens across multiple pods, and without proper observability, you'd be debugging each service in isolation, never seeing the full picture.
How Odigos Solves This Problem
This is where distributed tracing becomes invaluable. With Odigos set up for distributed tracing, you can see what's actually happening in those slow requests across all your services.
The Normal Flow vs. The Problem
Normal scenario: Here's what a healthy request looks like in Jaeger. Each request takes approximately 1 second and involves multiple services working together smoothly:
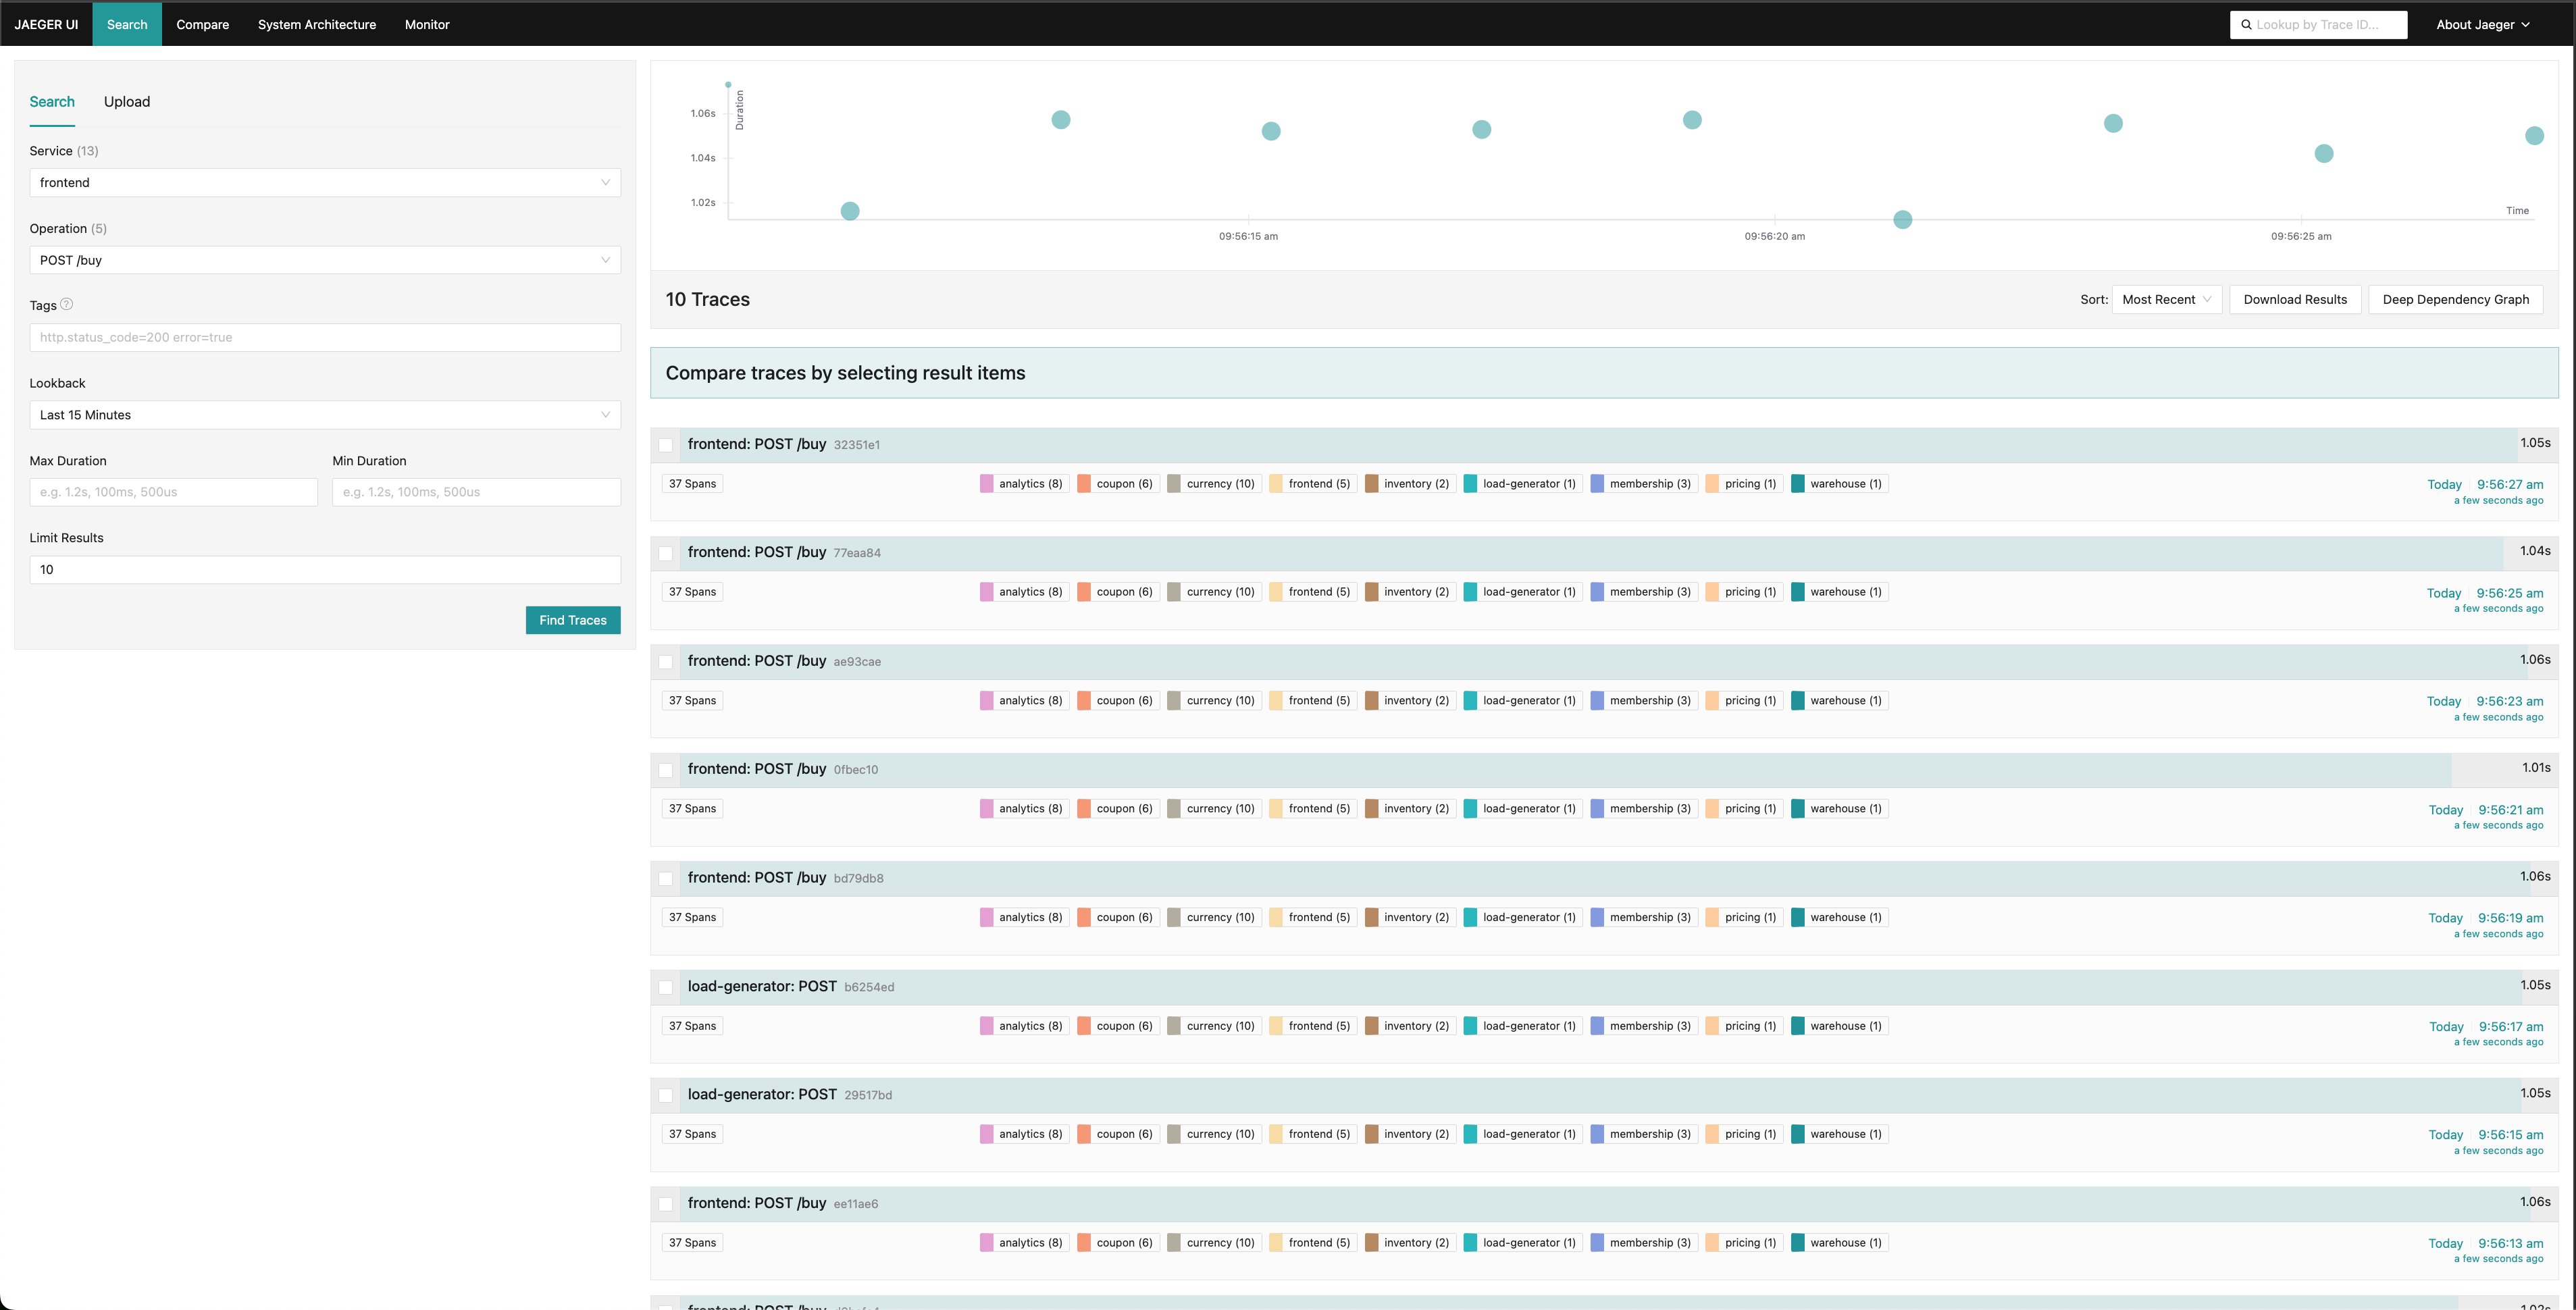
Normal flow: Each POST /buy request completes in ~1 second with 37 spans across various services
Problematic scenario: Here's the same request when a database lock occurs. Notice how one request takes over 5 seconds instead of the normal up to 1 second:
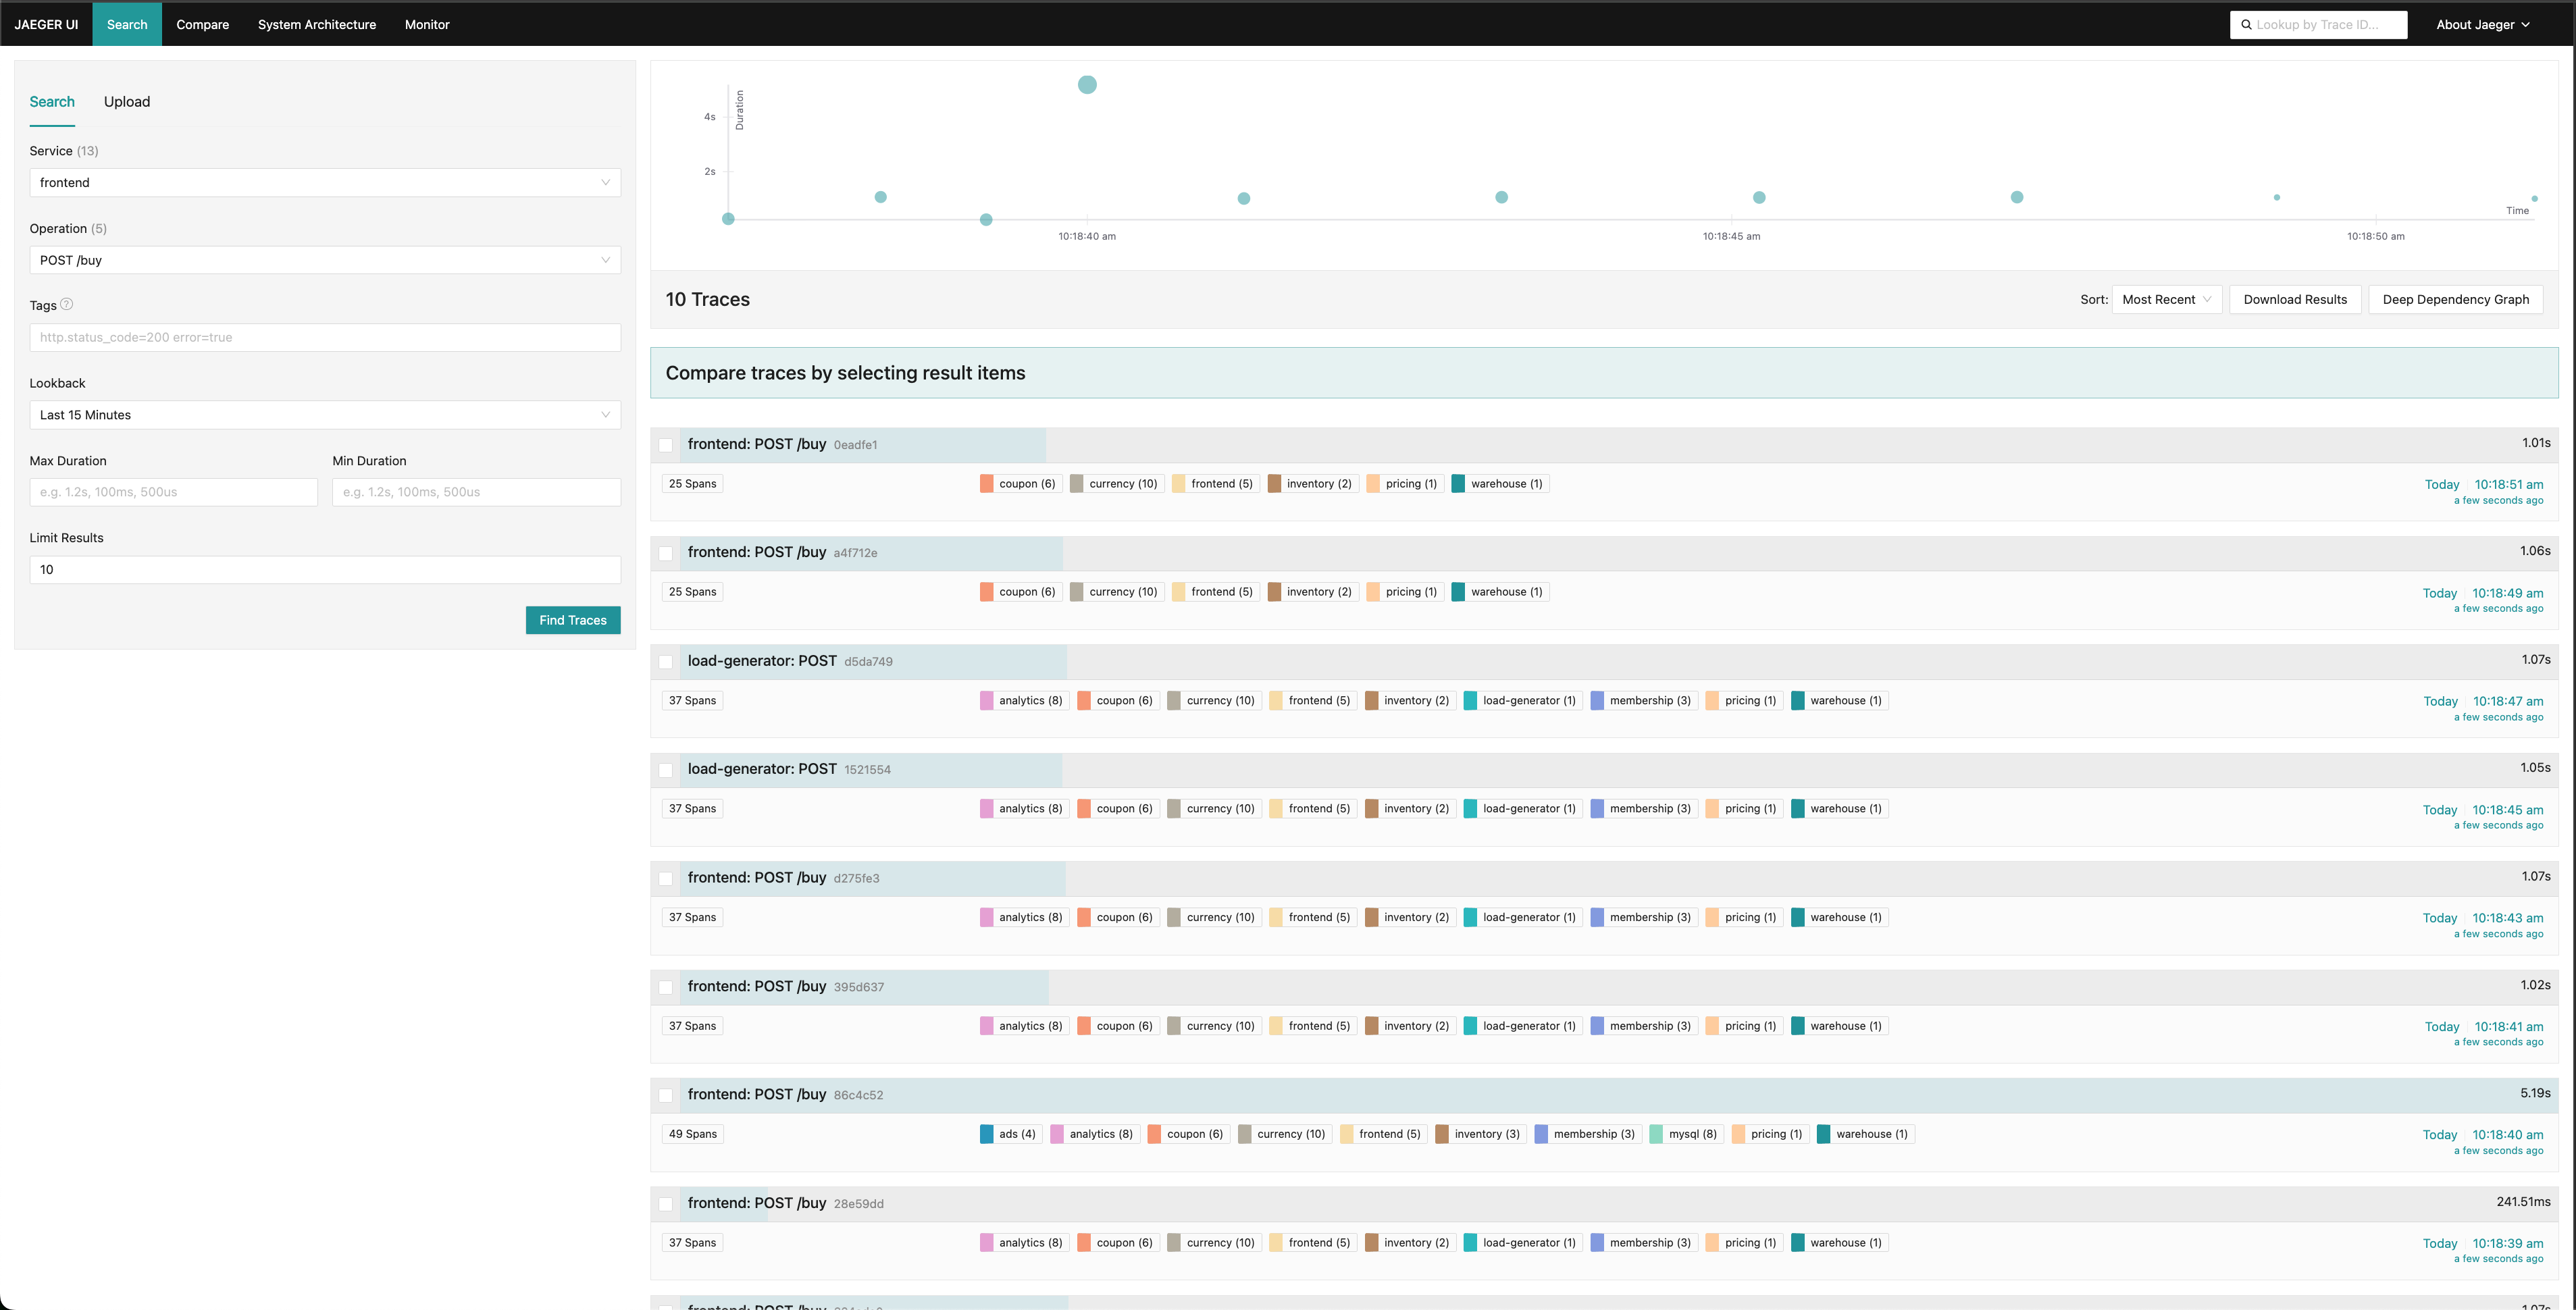
Problematic flow: One POST /buy request takes more than 5 seconds instead of the up to ~1 second
The Cascade Effect Revealed
The real impact becomes clear when you see how this affects other services. Here's what happens when the frontend tries to fetch products while the database is locked:
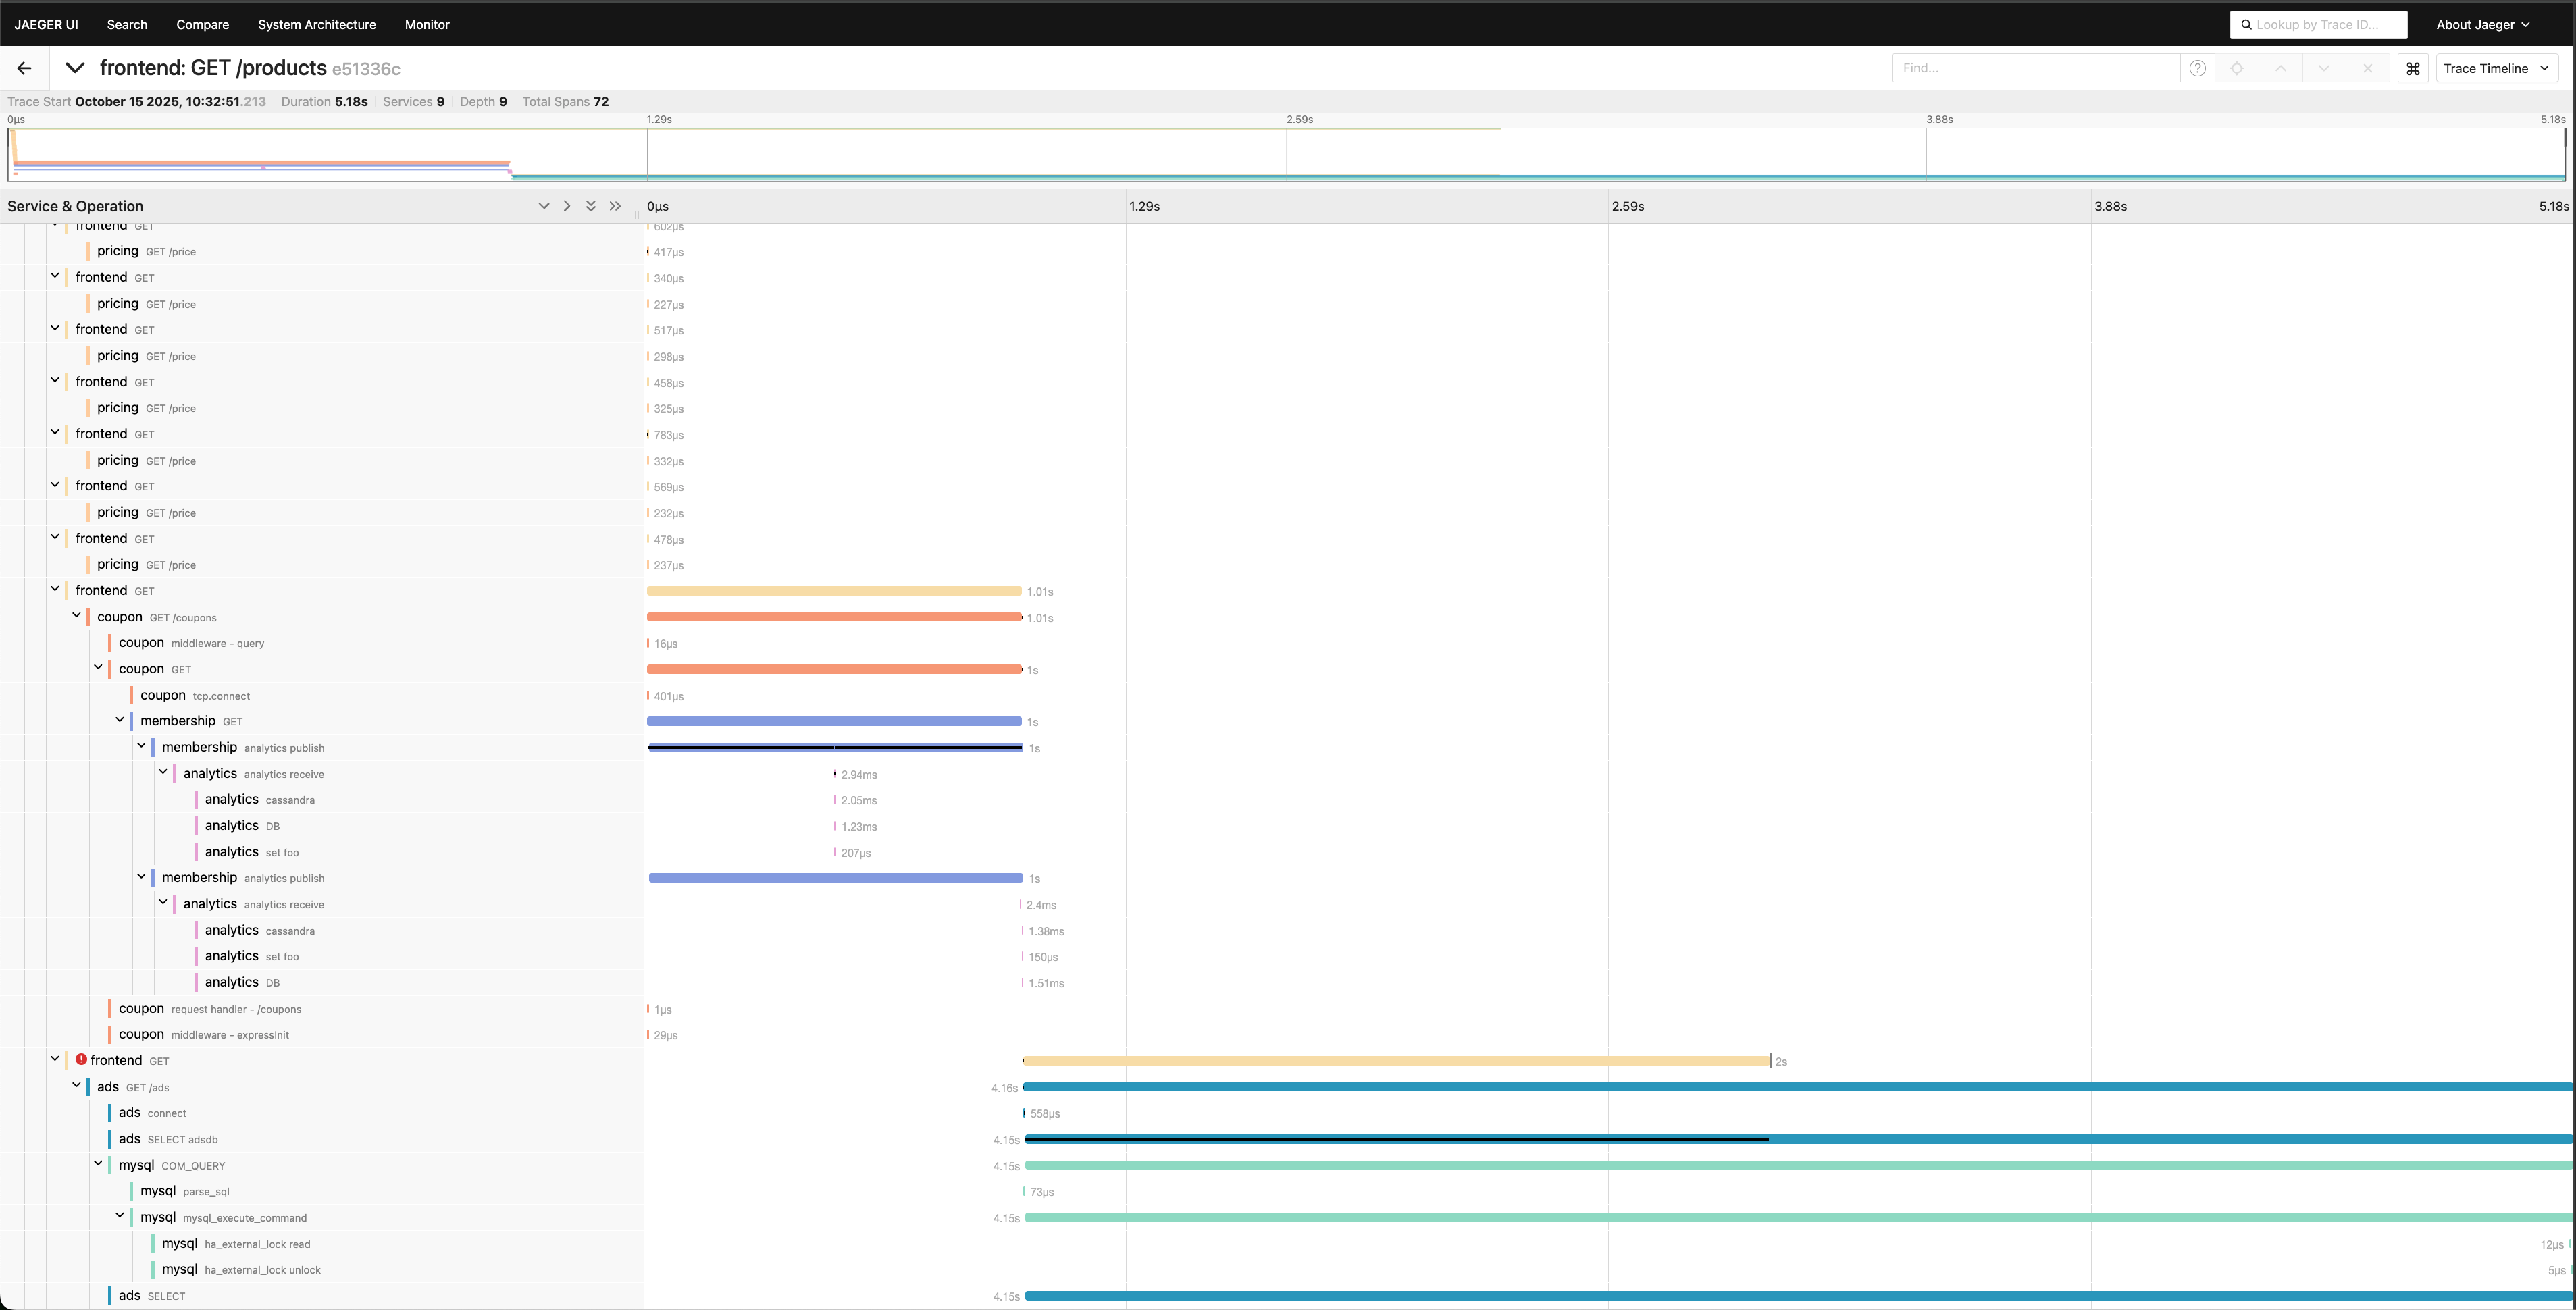
The frontend service gets a SocketTimeoutException when trying to fetch products, with the entire trace taking 5.18 seconds instead of the normal ~1 second
The Root Cause Analysis
Odigos' MySQL instrumentation provides valuable insights: You can see exactly what's happening at the database level. The trace shows you the mysql COM_QUERY and mysql_execute_command operations, and you can see that the database is taking much longer to respond than normal.
Looking at the trace details, you can see the error is a SocketTimeoutException and the URL being called is hitting your ads service. The trace reveals that the entire request takes 5.18 seconds, with the frontend service's GET operation taking 2.01 seconds, which is way beyond the normal ~1 second response time.
The Multi-Service Impact Revealed
What makes Odigos powerful is that it shows you the problem without requiring any code changes. You just deploy it, and suddenly you have visibility into:
- The exact call chain that's causing the timeout across multiple services
- Which service is the bottleneck (the ads service in this case)
- What operation is taking too long (the database query)
- The root cause (the table lock affecting the ads service)
- How the problem propagated through your service mesh
- The database-level operations that are causing the delay
The trace visualization makes it obvious that the database operation is taking much longer than normal. And the error details show you it's a SocketTimeoutException on your frontend service when it tries to communicate with the ads service.
Without Odigos, you'd be looking at individual service logs across multiple pods, trying to correlate timestamps, and probably going down rabbit holes about database performance or network issues.
The Solution
Once you figure out what's happening, the fix is usually simple. But the real lesson here is about observability in a microservices environment.
When you're running microservices on Kubernetes, you need to be able to see the full request flow across all your services. One service can easily impact another, and without proper tracing, you're debugging in the dark.
Odigos gives you that visibility automatically. No code changes, no configuration headaches, just deploy and start seeing what's actually happening in your system.
The Takeaway
If you're running microservices on Kubernetes and you don't have distributed tracing set up, you're basically debugging with one hand tied behind your back.
The next time you're staring at a mysterious timeout or performance issue, ask yourself: "Can I see the full request flow across all my services?" If the answer is no, it might be time to add some observability.
The key insight here is that in a distributed system running on Kubernetes, problems don't respect service boundaries. A database issue in one service can cause timeouts in another service that you'd never think to look at. Odigos helps you see these cross-service impacts in a multi-pod environment.
More from the blog.



Stop guessing. Ask production.
One agent. One service. See how Odigos helps answer a production question.