
The Death of the Debug Log? How Observability is Replacing Old Habits
Why debug logs are no longer our go-to
TL;DR
We’ve all learned to rely on debug logs like a safety blanket.
But in modern, distributed systems, they’ve become more noise than signal.
This post breaks down why debug logs are losing relevance, and what “modern observability” looks like when you stop staring at one line and start connecting all the dots.
The Problem: We’re Drowning in Logs
If you’ve ever tailed 10,000 lines of logs hoping to find a clue, you know the pain.
Logs used to be enough.
Then came microservices, clusters, autoscalers, load balancers, and all the other “must-have” cloud-native magic.
Yet somehow… we still reach for logger.debug() like it’s 2013.
If we managed to leave Harlem Shake, What Does the Fox Say, and Vine behind, why can’t we do the same with debug logs?
Maybe the problem isn’t the tooling.
Maybe the problem is the habit.
Old Habits: The Comfort of Debug Logs
We log because it’s easy.
Because it’s muscle memory.
Because grep feels like control in the chaos.
But in distributed systems, a local view can’t give you the full picture.
Recently, we hit an out-of-memory issue in one of our components.
Like most OpenTelemetry pipelines, we have several collectors, each handling a piece of the flow.
Looking at the logs, nothing seemed off.
So we added more logs.
And then more.
Eventually, we noticed something: the retry mechanism was working overtime. Retries are part of the “happy path,” so we weren’t logging any errors.
Only when we cranked up the verbosity to debug did we see just how many spans were stuck retrying.
It’s About the Destination, Not the Journey
After hopping from one collector to another, we finally found it, the destination was slow.
High latency caused retries and backpressure all the way up the chain.
It took hours, and several redeploys, to add enough logs, collect them, and piece the story together.
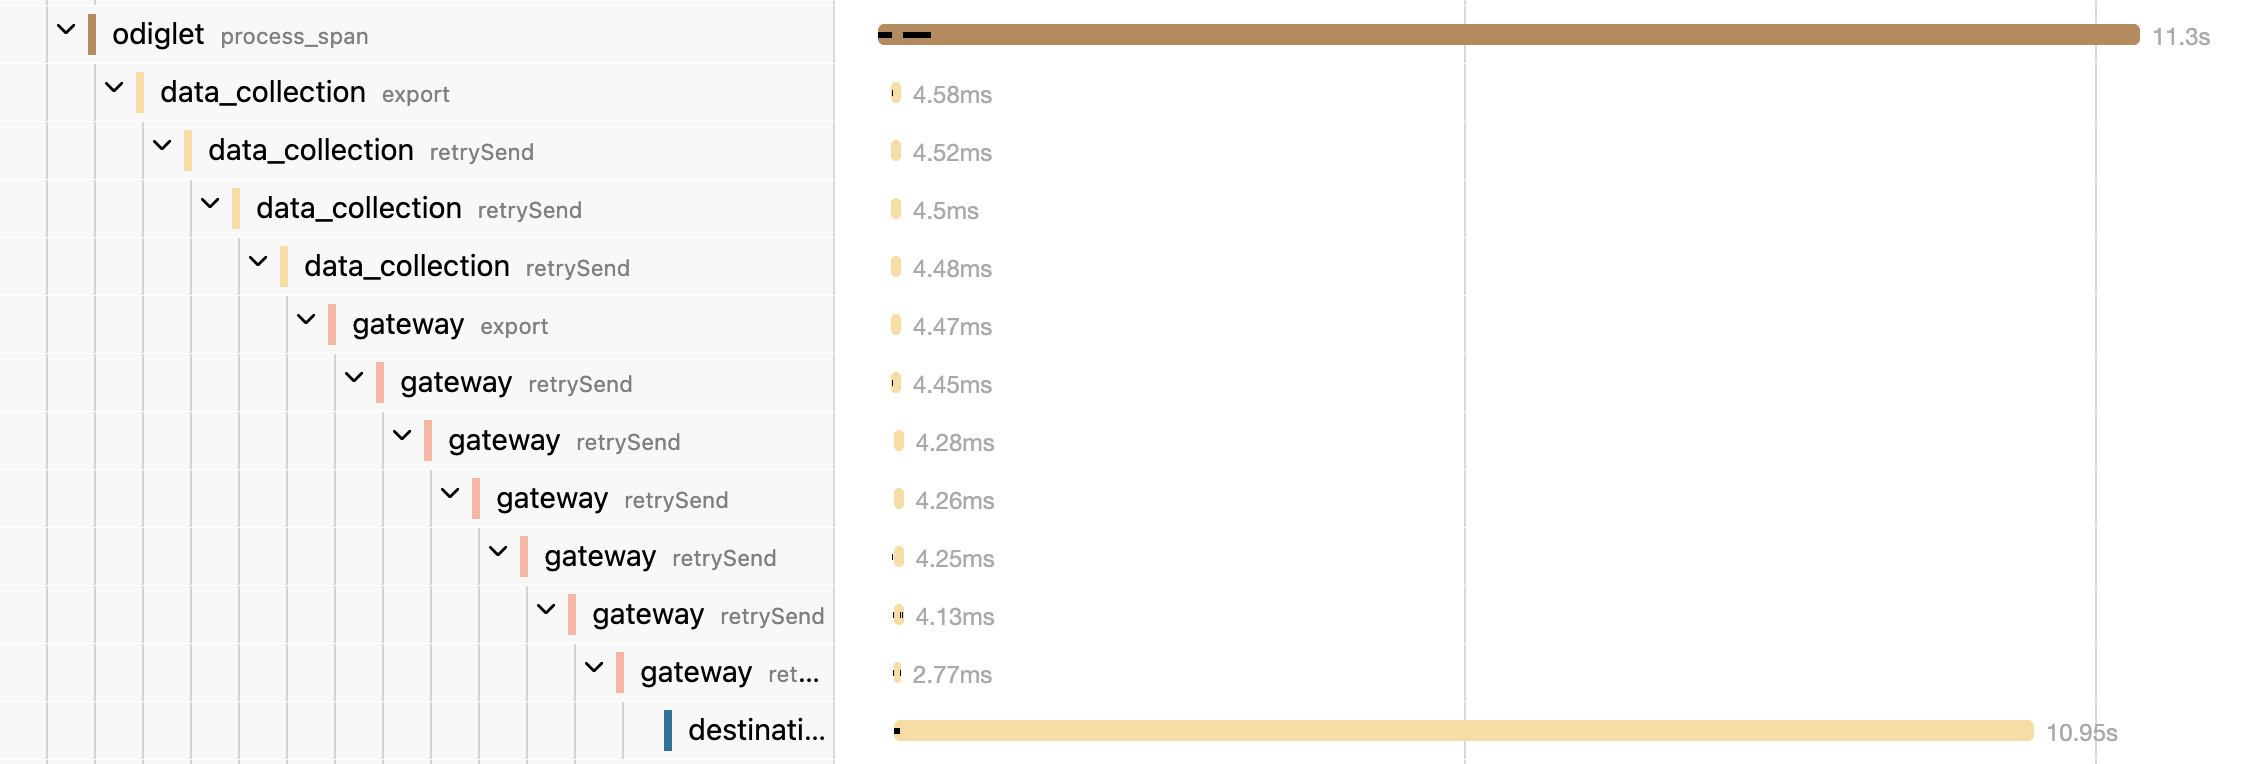
Now imagine solving this with traces instead.
What Are Traces?
Traces (or distributed traces) are like a map of your request’s journey.
Each span is a stop along the way, showing how long it took and what happened at each hop.
One look at a trace, and you can see what a thousand log lines are trying to tell you.
Trace ID: 45ac3f…
 ├── collector-a → 12ms
 ├── collector-b → 10ms
 ├── collector-c (3 retries) → 2100ms ⚠️
 └── destination (latency: 1.8s)
A Different Route
If we’d had tracing in place, the story would’ve been clear immediately:
A few retries here, a few there, and one final destination taking much longer than expected.
That’s the power of observability. It’s not about reading logs, it’s about seeing behavior.
Conclusion
Next time you’re debugging a problem in your distributed, multi-cluster, load-balanced, cloud-native system, try adding some traces.
Logs are great for what’s happening inside a single component.
Traces tell you the story of the entire request, end to end.
If you want to start small, check out OpenTelemetry.
Or, if you’d like a quick way to bootstrap traces with zero code changes, give Odigos a try.
Your future self (and your on-call rotation) will thank you.
More from the blog.



Stop guessing. Ask production.
One agent. One service. See how Odigos helps answer a production question.