
How Odigos Exposed a Hidden Database Lock
How I used Distributed Traces from Odigos, to troubleshoot an Application problem
How Odigos Exposed a Hidden Database Lock
In modern distributed systems, performance problems rarely show up where they originate. A user-facing service appears slow or broken, while the real issue sits several hops away in a dependency that most engineers weren’t even thinking about. This is especially true at enterprise scale and in a microservice architecture, where a single trace can be comprised of hundreds of services. This is why distributed tracing has become such a critical observability signal: it provides context across services, databases, and infrastructure, showing not just what is slow, but where the system is blocked.
With Odigos, that visibility comes automatically. By instrumenting all applications at runtime with eBPF, Odigos captures distributed traces and metrics without requiring developers to modify application code. That means when something goes wrong, the data you need to understand it is already there.
This is a story about how that visibility turned a hanging frontend into a clearly diagnosed MySQL database lock in minutes.
A Frontend That Just Hangs...
The problem surfaced in the simplest way possible. I tried to load the frontend of an application, specifically the products page, and the page never loaded. There was no error message, no stack trace, and no obvious failure. From the outside, the frontend simply appeared stuck with a small "loading" message in the upper left.
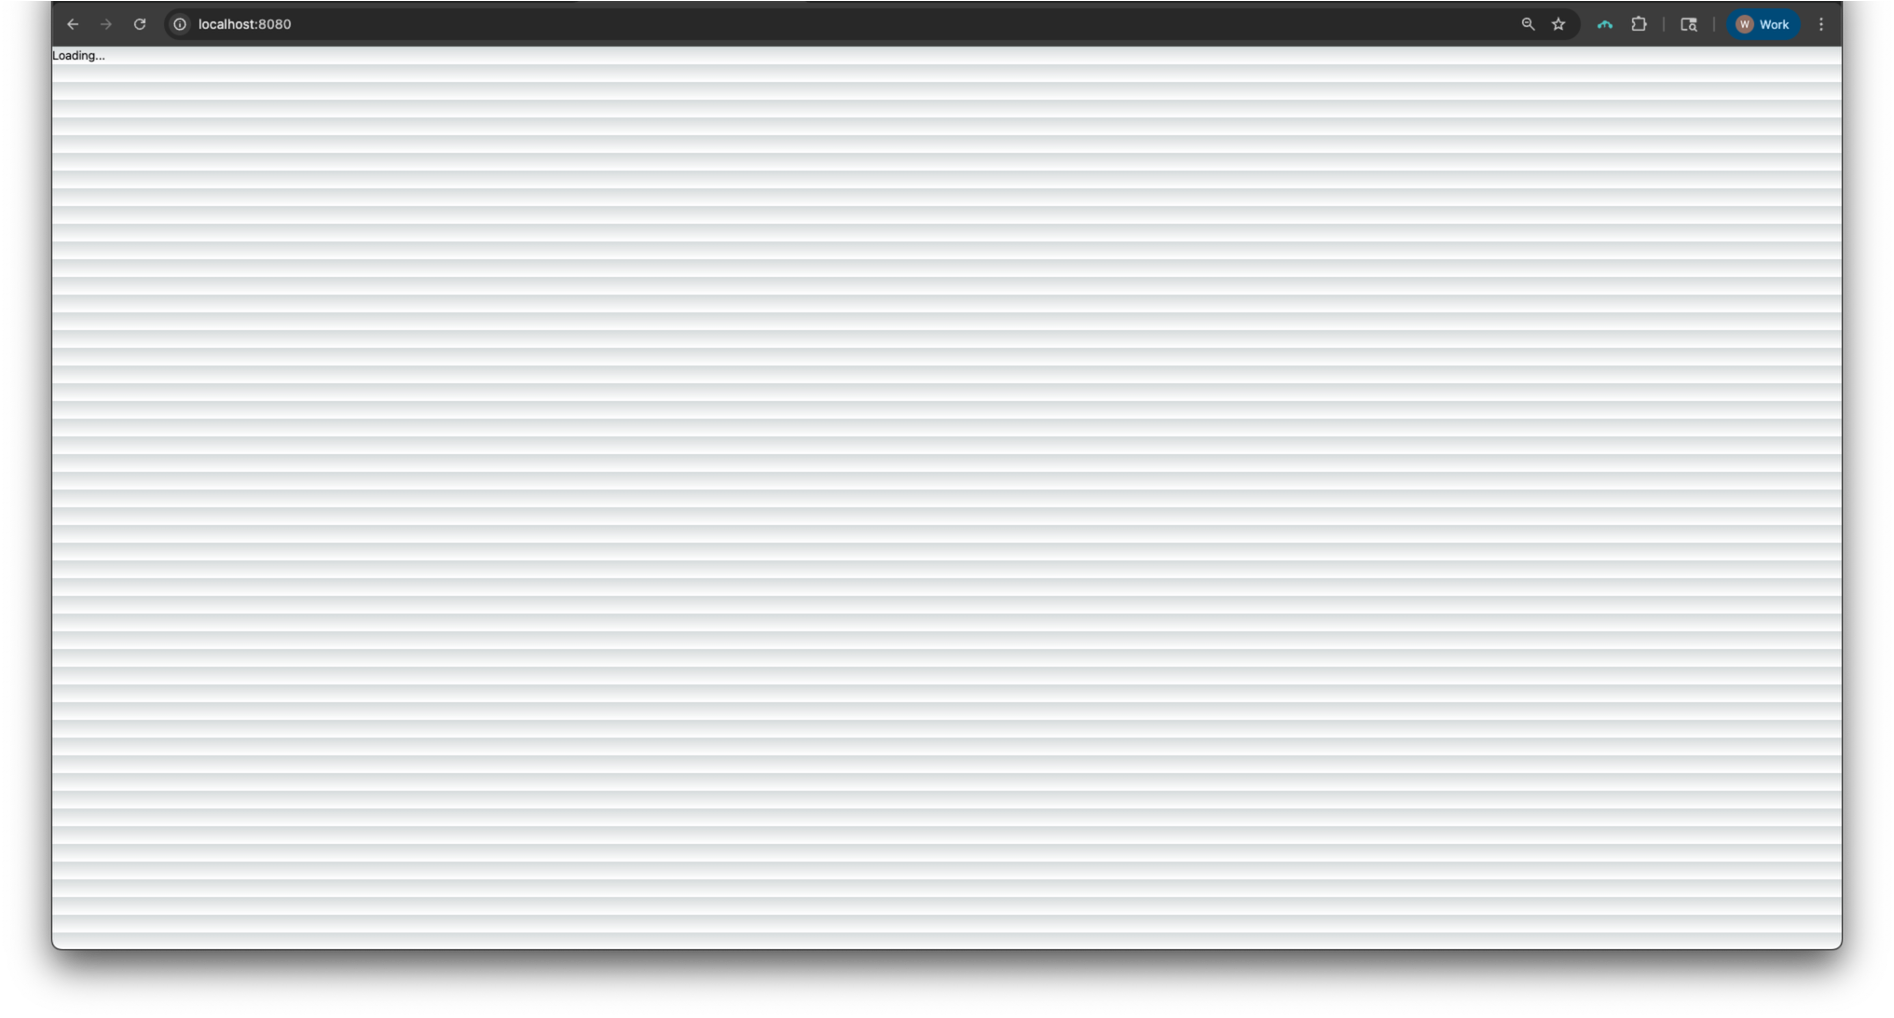
At this point, there are countless possible explanations. The frontend could be misbehaving. A backend service might be overloaded. A network call could be timing out. Or a database might be slow. Without context, I am left guessing…. and guessing in distributed systems is expensive!
Instead of chasing endless logs across services, I went straight to Grafana and opened the trace for the request. Odigos had already instrumented every service involved, so the full end-to-end trace was waiting for me.
Seeing The Blast Radius With A Single Trace
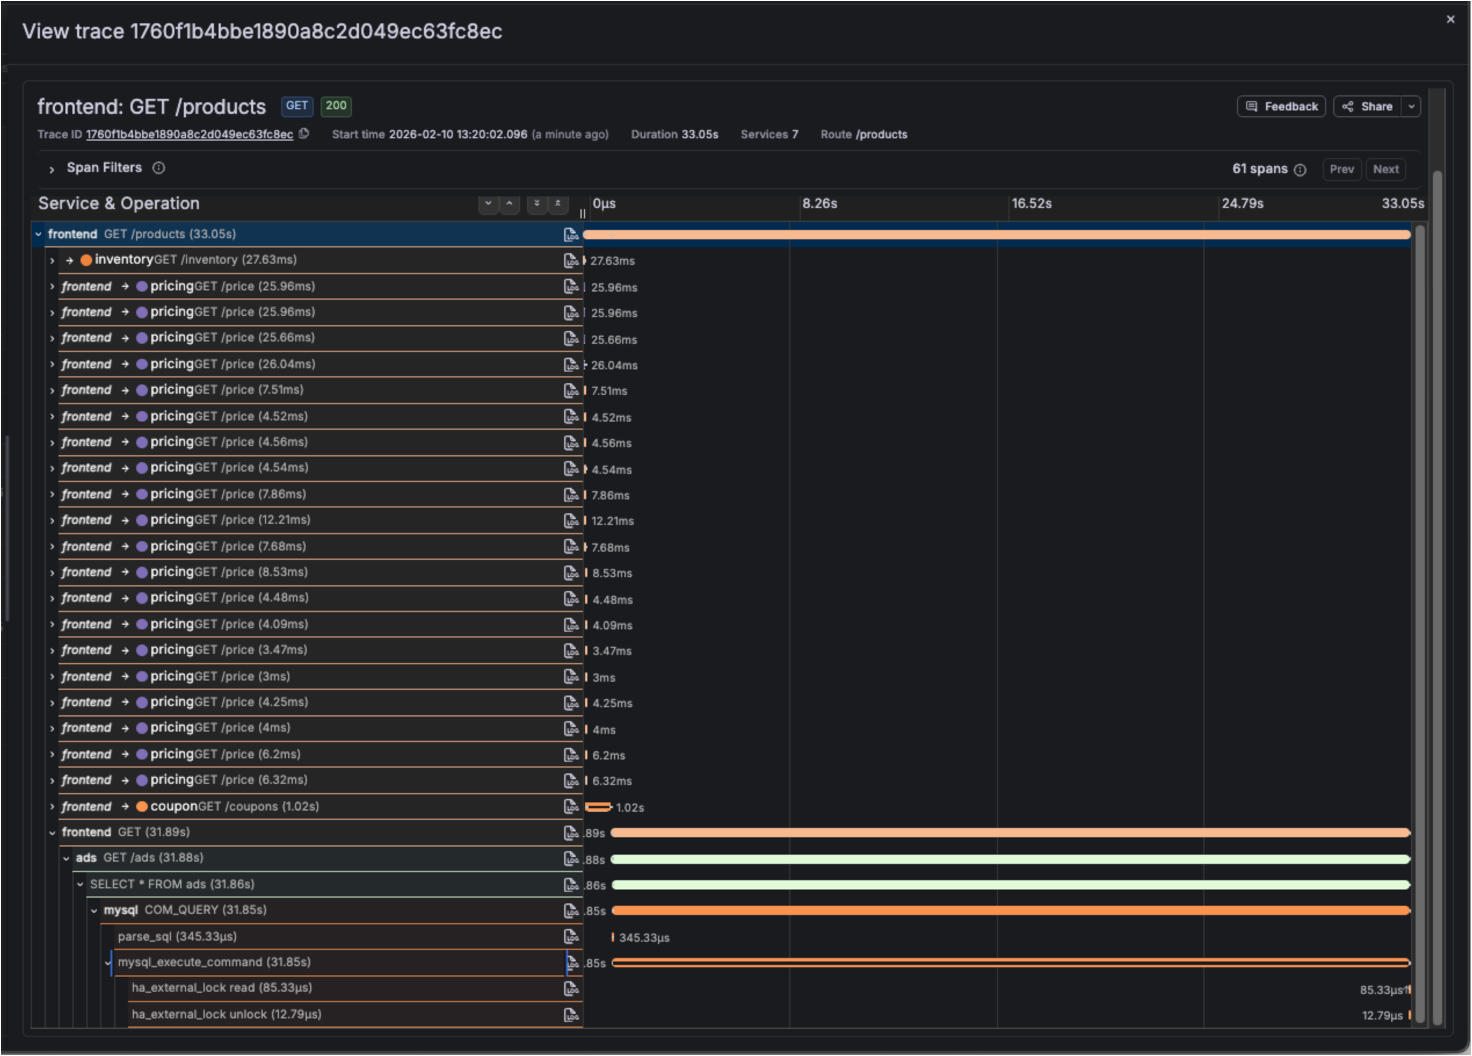
The trace immediately told a clear story. The frontend received the request and made a call to the ads service. The ads service, in turn, sent a query to MySQL. That’s where everything slowed down.
One span stood out dramatically: a MySQL span named mysql_execute_command, running for over 20 seconds! Every upstream span (the frontend request, the HTTP call to the ads service, the ads handler itself) aligned perfectly with that long database span. Nothing else in the system was slow. Everything was simply waiting.
This is where distributed tracing really earns its value. Without Odigos, this delay might have shown up as “high latency” in multiple services, obscuring the true cause. With Odigos, the trace made it immediately obvious that the entire request path was blocked behind a single database operation.
Slow Database or Something Else?
A long database span doesn’t always mean the database is overloaded or executing an inefficient query. Context matters. Thanks to Odigos, I could correlate the trace with infrastructure-level metrics from the same timeframe.
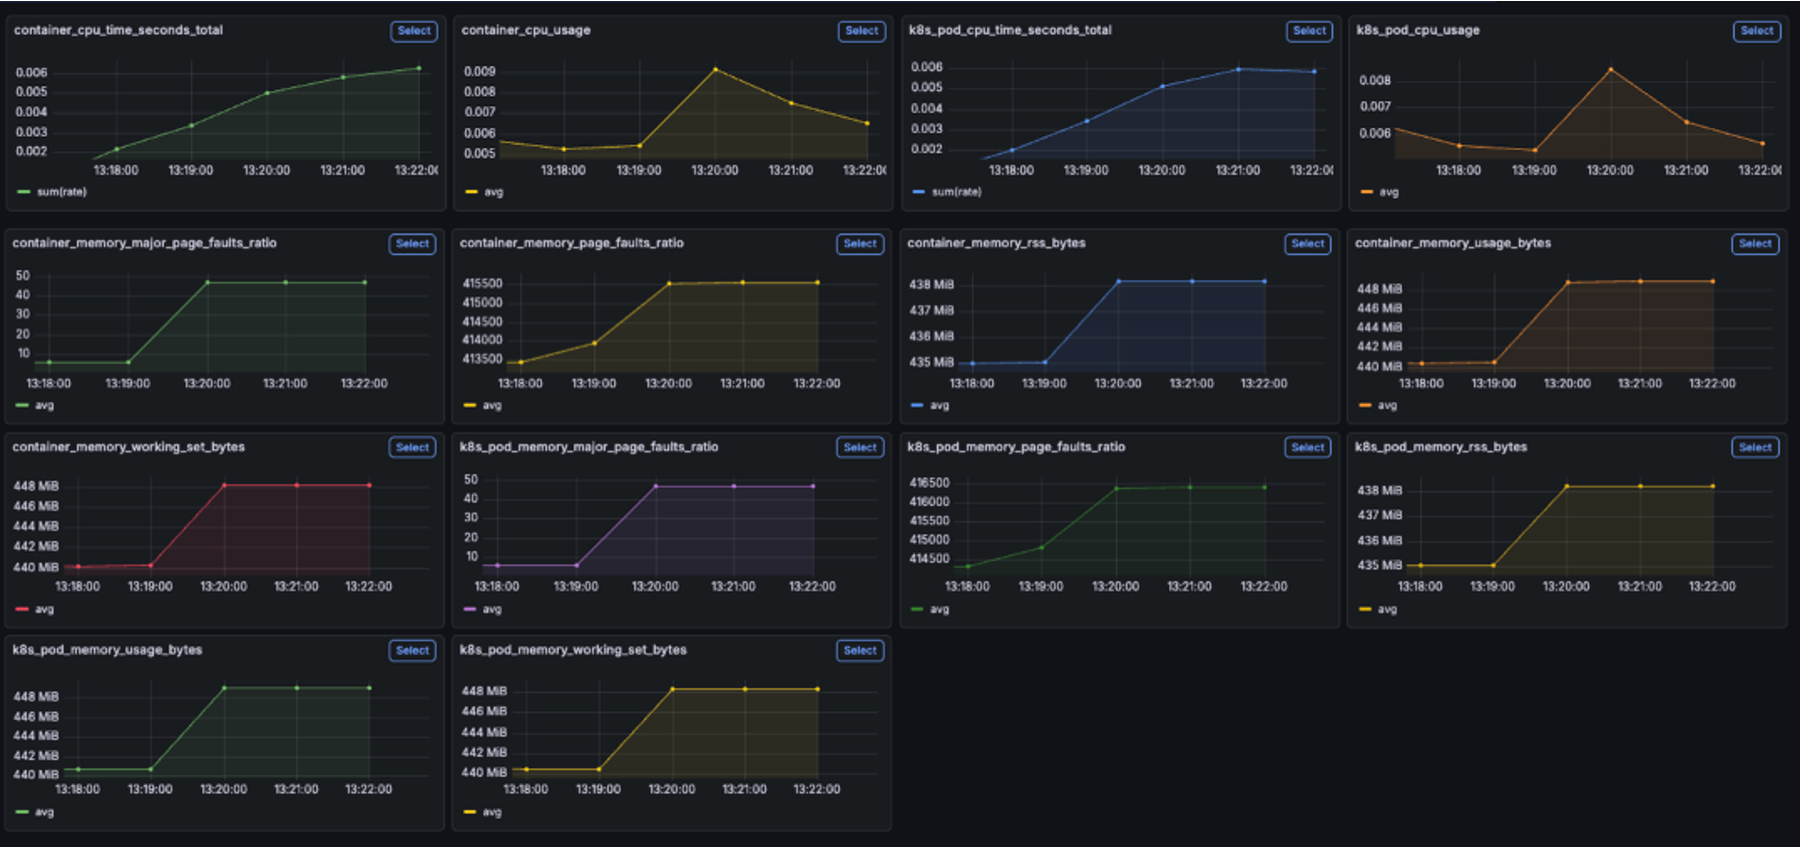
The MySQL pod wasn’t under CPU pressure. Memory usage was stable. There were no restarts, throttling events, or signs of resource exhaustion. The database wasn’t starving by any means.
That combination is a strong signal that the query wasn’t working for 20 seconds. It was waiting.
And that usually means locking!
Confirming the Lock
With the trace pointing squarely at MySQL, confirming the suspicion was straightforward. I opened a MySQL session and ran:
SHOW FULL PROCESSLIST;

There it was. The query coming from the ads service (adsuser) was stuck in a waiting state, blocked by another session holding a lock on the table. The database wasn’t slow by accident, it was doing exactly what it was designed to do.
At this point, there was no ambiguity. Odigos had already narrowed the problem down to a single service and a single dependency. The database confirmed the rest.
Resolution and Recovery
Once the blocking lock was released, the system recovered instantly. The MySQL query completed, the ads service responded, and the frontend page loaded as expected. No redeploys. No pod restarts. No configuration changes.
Just a precise fix applied exactly where it was needed.
Why Odigos Made The Difference
The key insight here isn’t just that the problem was a database lock, it is how quickly that conclusion was reached. Odigos automatically instrumented the application stack and provided complete traces and metrics without requiring any prior anticipation of this failure mode.
The long mysql_execute_command span alone didn’t explicitly say “this is a locking problem.” But with the proper context the story became unmistakable.
Without distributed tracing, this issue would have looked like a “slow frontend” or a “slow backend.” With Odigos, it was clear that the frontend was just the victim, and the real issue originated in a single blocked database operation.
This is the power of automatic observability: when something breaks, you’re not starting from zero. You’re starting from the truth!
More from the blog.



Stop guessing. Ask production.
One agent. One service. See how Odigos helps answer a production question.