
Introducing Continuous Profiling in Odigos: Low Overhead, Zero Extra Storage
Continuous profiling is now built into Odigos. Collect and visualize profiles directly in Odigos with a lightweight in-memory experience, and optionally export via OTLP Profiles for historical analysis in your favorite destinations.
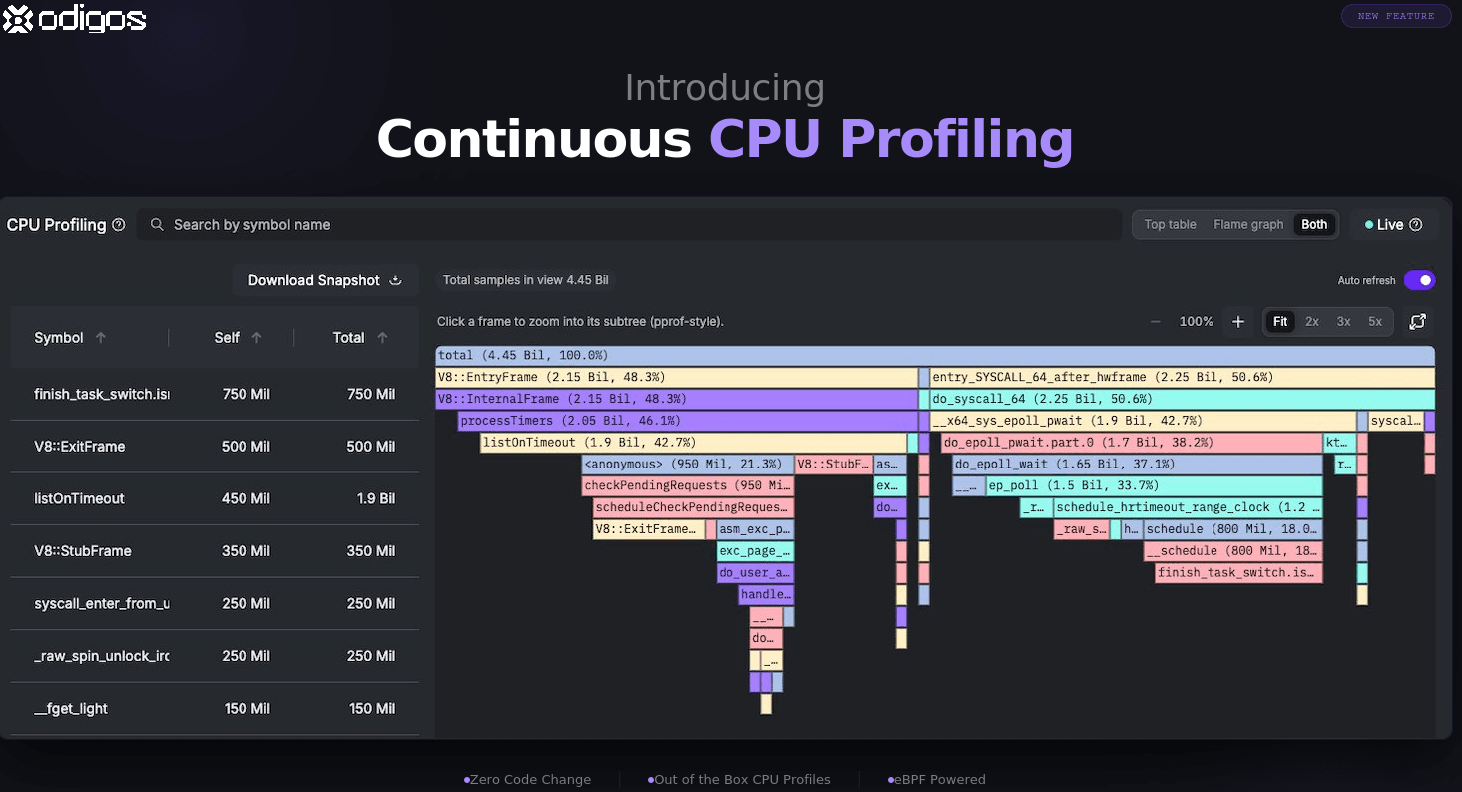
Profiling is one of the fastest ways to find real performance bottlenecks. But for most teams, getting started still means adding extra components, extra storage, and extra operational complexity before anyone can get useful insights.
Team Odigos is proud to announce that continuous profiling is now available out of the box starting with Odigos v1.25.0 and above.
You can now collect and visualize continuous profiling data directly in Odigos, with a lightweight experience designed for production environments.
Why this matters
This launch gives teams two immediate benefits when it comes to adopting profiling as the 4th pillar in your observability stack:
- Ready to use: quickly start using CPU profiling directly in Odigos without needing a separate profiling database or visualizer.
- Low operational overhead: keep the in-product experience lightweight while still getting continuous CPU profiles.
How it works
The Odigos profiling experience is designed to be low overhead, with no extra storage required, and optimized for speed at scale:
- Profile data is handled in-memory for quick access in the product—no extra storage needed to get started.
- The in-memory model is bounded and lifecycle-managed to stay lightweight.
- Teams can focus on investigation and optimization, not managing additional profiling infrastructure.
This approach is ideal for taking a quick look at profiling data for your applications, understanding the libraries they rely on, and planning better instrumentation.
See it in action
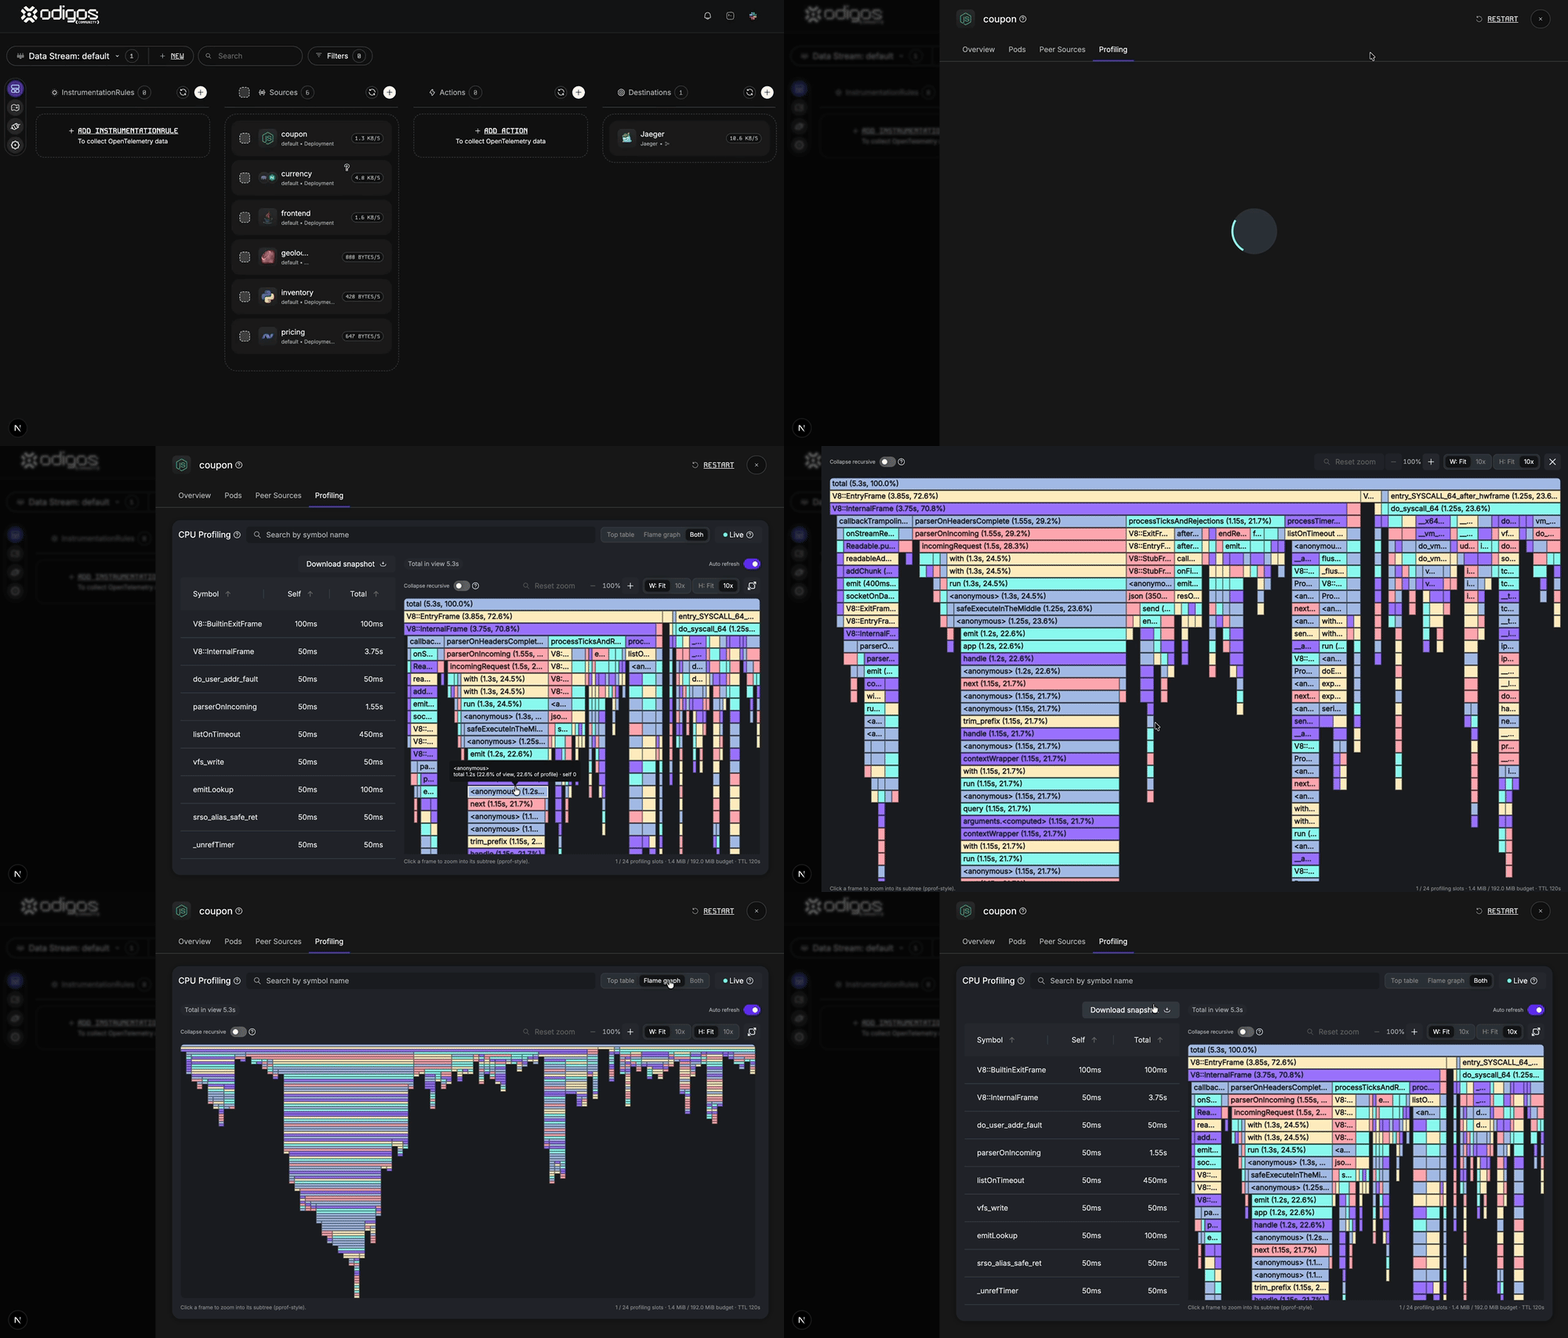
Here’s a quick walkthrough of continuous profiling in Odigos from enablement to inspecting a workload:
Powered by upstream OpenTelemetry eBPF profiling
Odigos continuous profiling is powered by the upstream OpenTelemetry eBPF Profiler, which is embedded in the Odigos data collector.
That gives Odigos users a production-oriented profiling foundation built on open source standards and ongoing upstream innovation.
What languages are supported
The Odigos profiling experience supports profiling across a broad set of languages and runtimes, including:
- Java
- Python
- Ruby
- PHP
- Node.js
- Perl
- Erlang
- .NET
- Go
- Native executables (including C/C++, Rust, and Zig)
In addition, mixed stack traces across runtimes are supported, which helps in real-world polyglot services where performance hotspots cross language boundaries.
Need historical profiling data?
For teams that want to keep and analyze profiling data over longer periods, Odigos also supports exporting profiles to OTLP Profiles-compatible destinations.
That gives you a simple split:
- Odigos in-product profiling for immediate visibility.
- OTLP export to destinations for historical retention and time-range analysis.
What’s next? From insight to better instrumentation
Continuous profiling is not just another signal to collect. It also lays the groundwork for richer, fine-grained instrumentation capabilities in Odigos.
Future Odigos releases will use profiling data to drive more fine-grained instrumentation decisions and advanced product capabilities.
More from the blog.



Stop guessing. Ask production.
One agent. One service. See how Odigos helps answer a production question.