
Deploy a Production Grade Grafana Trace Facility in Minutes Supercharged by Odigos
Use an OSS Grafana Stack with Tempo and Prometheus to store and visualize Odigos traces

Deploy a Production Grade Grafana Trace Facility in Minutes Supercharged by Odigos
In today’s world of skyrocketing observability costs, it’s easy to forget that great visibility doesn’t have to come with a giant price tag. Companies are spending millions of dollars each year on APM tools that lock them into proprietary agents and opaque pricing. Meanwhile, the open-source observability ecosystem has matured into something incredibly powerful: Grafana for visualization, Tempo for distributed tracing, and Prometheus for metrics, all battle tested at enterprise scale and free to run on your own infrastructure in minutes!
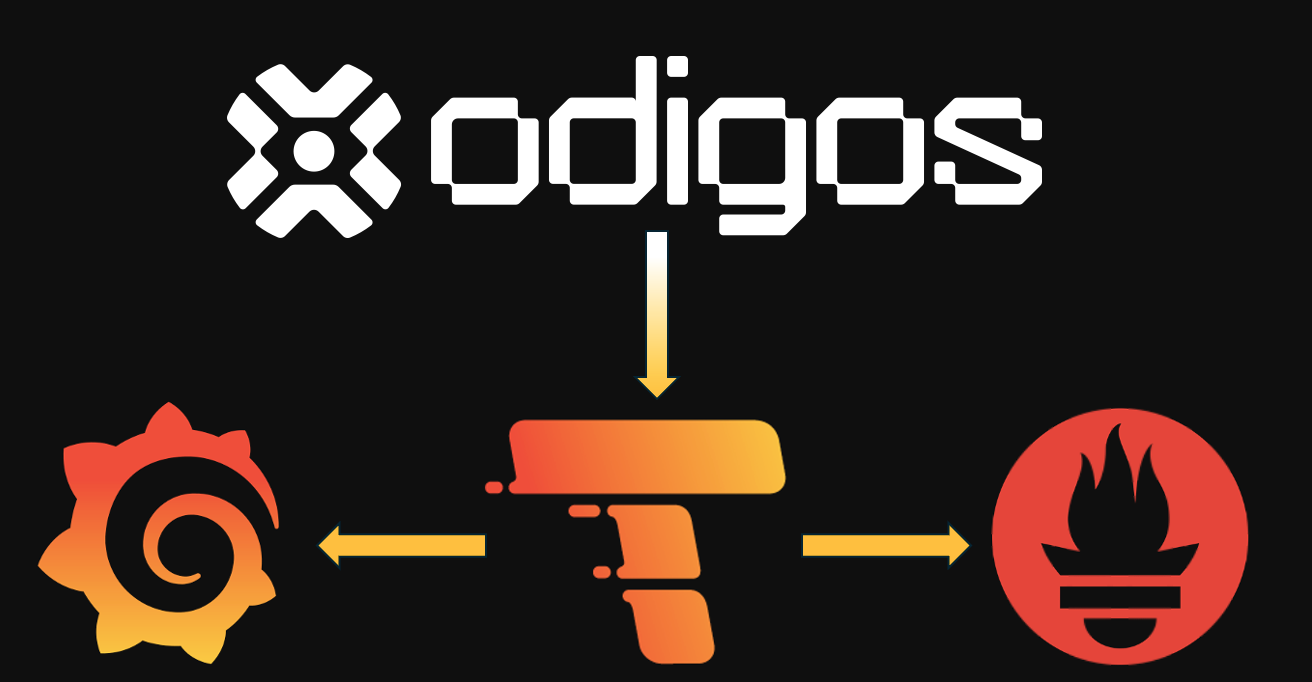
But here’s the real magic… with Odigos, you can turn this OSS stack into a production grade tracing powerhouse in minutes, no manual instrumentation, no code changes, and no waiting months for value. Odigos acts as your observability supercharger, automatically instrumenting and forwarding high fidelity OTEL traces from your workloads to Grafana Tempo. Within moments, you have rich trace visualizations, span level metrics in Prometheus, and full dashboards in Grafana, all from an open-source stack you control.
The result is instant observability and enterprise grade tracing without enterprise grade bills.
In this guide, we’ll show you exactly how to deploy a production ready Grafana Tempo Prometheus stack on Kubernetes, configured to store traces in S3, stream span metrics, and visualize everything in Grafana. All powered by Odigos, so you spend less time wiring telemetry and more time understanding what’s happening in your systems.
Step 1: Deploy Grafana, Prometheus, and Tempo
In this first step, we will lay the foundation for our observability stack by deploying the core OSS components: Grafana for visualization, Prometheus for metrics, and Tempo for distributed tracing. Together, these form the backbone of a production-grade tracing environment and it is all fully open source, scalable, and ready to handle real-world workloads.
Grafana
Add and update the Grafana helm repo
helm repo add grafana https://grafana.github.io/helm-charts
helm repo update
Create a namespace for Grafana UI
kubectl create namespace grafana
helm install grafana-ui grafana/grafana -n grafana
Get the auto-generated password
kubectl get secret -n grafana grafana-ui \
  -o jsonpath="{.data.admin-password}" | base64 --decode ; echo
Then port-forward the UI service (or to make it more accessible you can expose this behind a LoadBalancer)
kubectl -n grafana port-forward <the-svc-name> 3000:3000
or….
helm upgrade --install grafana-ui grafana/grafana -n grafana \
  --set service.type=LoadBalancer
Now that your Grafana UI is up and running its time to setup Prometheus and Tempo and add them as datasources.
Prometheus
This Prometheus deployment provides a lightweight, self-contained monitoring setup for Kubernetes. It runs without Alertmanager or Pushgateway, using persistent storage (50 Gi) and a 24-hour data retention window. I configured this to use the gp2 storage class since I am deploying on EKS and my default is gp2, but you can easily swap this out for another storage class like gp3, etc. It scrapes node-exporter, kube-state-metrics, and itself every 15-seconds too. This configuration enables the remote-write receiver feature at at /api/v1/write, accepting telemetry from Tempo’s metrics generator. It provides a solid foundation for integrating distributed tracing metrics from Tempo at a later step.
Values File
alertmanager:
  enabled: false

pushgateway:
  enabled: false

kubeStateMetrics:
  enabled: true

prometheus-node-exporter:
  enabled: true

server:
  retention: 24h
  resources:
    requests:
      cpu: "500m"
      memory: "2Gi"
    limits:
      cpu: "2"
      memory: "4Gi"

  extraArgs:
    enable-feature: remote-write-receiver
  extraFlags:
  - web.enable-remote-write-receiver

  service:
    type: ClusterIP
    servicePort: 9090
    targetPort: 9090

  persistentVolume:
    enabled: true
    size: 50Gi
    storageClass: gp2
    accessModes: ["ReadWriteOnce"]

  global:
    scrape_interval: 15s
    evaluation_interval: 30s

  securityContext:
    runAsUser: 65534
    runAsGroup: 65534
    fsGroup: 65534
    fsGroupChangePolicy: "OnRootMismatch"

serverFiles:
  prometheus.yml:
    scrape_configs:
      - job_name: 'prometheus'
        static_configs:
          - targets: ['localhost:9090']

      - job_name: 'node-exporter'
        kubernetes_sd_configs:
          - role: endpoints
        relabel_configs:
          - source_labels: [__meta_kubernetes_service_label_app_kubernetes_io_name]
            regex: prometheus-node-exporter
            action: keep
          - source_labels: [__meta_kubernetes_endpoint_port_name]
            regex: metrics
            action: keep

      - job_name: 'kube-state-metrics'
        kubernetes_sd_configs:
          - role: endpoints
        relabel_configs:
          - source_labels: [__meta_kubernetes_service_label_app_kubernetes_io_name]
            regex: kube-state-metrics
            action: keep
          - source_labels: [__meta_kubernetes_endpoint_port_name]
            regex: http-metrics
            action: keep
Using the configuration from the values file above, we can deploy prometheus directly to our Kubernetes cluster.
Add the helm repo and update
helm repo add prometheus-community https://prometheus-community.github.io/helm-charts
helm repo update
Deploy prometheus (make sure to replace the values file with what you named your file)
helm upgrade --install prometheus prometheus-community/prometheus \
  --namespace monitoring \
  --create-namespace \
  -f prometheus-values.yaml
Once all the pods are up, we can move on to deploy tempo!
Tempo
Now that we have Prometheus and Grafana running the final step is to configure Tempo to run in the cluster and store traces in s3. The following steps assume you have the AWS CLI installed and a bucket already created that you would like to use.
Create a minimal, least-privilege S3 policy JSON. Replace <your-s3-bucket> with the name of your bucket.
cat > tempo-s3-policy.json <<'JSON'
{
  "Version": "2012-10-17",
  "Statement": [
    { "Effect": "Allow", "Action": ["s3:ListBucket"], "Resource": "arn:aws:s3:::<your-s3-bucket>" },
    { "Effect": "Allow", "Action": ["s3:GetObject","s3:PutObject","s3:DeleteObject"], "Resource": "arn:aws:s3:::<your-s3-bucket>/*" }
  ]
}
JSON
Now apply this through the AWS CLI
aws iam create-policy --policy-name TempoS3Policy \
  --policy-document file://tempo-s3-policy.json
Enable IRSA and bind the role to a Service Account (the commands below create a Service Account but feel free to use your own) Replace $CLUSTER_NAME, $AWS_REGION, $NAMESPACE, and $POLICY_ARN with your own values.
eksctl utils associate-iam-oidc-provider \
  --cluster "$CLUSTER_NAME" \
  --region  "$AWS_REGION" \
  --approve

eksctl create iamserviceaccount \
  --cluster "$CLUSTER_NAME" \
  --region  "$AWS_REGION" \
  --namespace "$NAMESPACE" \
  --name tempo \
  --attach-policy-arn "$POLICY_ARN" \
  --role-name eks-irsa-tempo \
  --approve
Now we can create a values file to use when we deploy Tempo. A few things to note here that you can customize.
First, in the values you can set the tempo.structuredConfig.query_frontend.search.max_duration to any value you wish.
This value defines how far back to can query traces when everything is hooked up to Grafana. The current value of 12h
means that I can query Tempo for Traces up to 12 hours ago. Traces over 12 hours old, will still exist in S3, but you cannot query them.
This helps to save on I/O costs with S3, but can be tuned to your liking. Secondly, you will need to modify the
tempo.structuredConfig.storage.trace.s3 block with your bucket, region and endpoint. Finally, just make sure the
metrics_generator.storage.remote_write URL is correct. If you follow the instructions above exactly, you can leave
what I have in there as is.
serviceAccount:
  create: false
  name: tempo

metricsGenerator:
  enabled: true
  # Optional tuning:
  # replicaCount: 1
  # resources:
  #   requests:
  #     cpu: 200m
  #     memory: 512Mi

tempo:
  structuredConfig:
    memberlist: {}
    distributor:
      receivers:
        otlp:
          protocols:
            grpc: {}
            http: {}
    ingester:
      max_block_duration: 5m
    compactor:
      compaction:
        block_retention: 720h
        compacted_block_retention: 10m
    query_frontend:
      search:
        max_duration: 12h
    storage:
      trace:
        backend: s3
        s3:
          bucket: "xxxxxxxxx"
          region: "xxxxxxxxxx"
          endpoint: s3.xxxxxxx.amazonaws.com
    metrics_generator:
      ring:
        kvstore:
          store: memberlist
      storage:
        path: /var/tempo/generator/wal
        remote_write:
          - url: "http://prometheus-server.monitoring.svc.cluster.local:9090/api/v1/write"
            send_exemplars: true
      traces_storage:
        path: /var/tempo/generator/traces
    overrides:
      defaults:
        metrics_generator:
          processors:
            - service-graphs
            - span-metrics
            - local-blocks
traces:
  otlp:
    grpc:
      enabled: true
    http:
      enabled: true
minio:
  enabled: false
queryFrontend:
  service:
    type: LoadBalancer
distributor:
  service:
    type: ClusterIP
Note that this deploys the query frontend service with a LoadBalancer. This service will be the URL for the Tempo datasource in Grafana, so if Grafana runs in another cluster or envornment you will need a loadBalancer to allow communication between Grafana and the Tempo-query-frontend service.
With the values file saved, you can install Tempo with helm using this values file.
helm upgrade --install tempo grafana/tempo-distributed \
  -n tracing --create-namespace \
  -f values-s3.yaml
This deploys Tempo in a distributed configuration. Deploying Tempo this way lets you scale each component independently for better performance, reliability, and flexibility. It separates ingestion, querying, and storage so heavy workloads don’t affect each other, and enables high availability, caching, and faster queries at production scale.
Step 2: Setup Odigos
With your Grafana, Tempo, and Prometheus stack now running, it’s time to bring it to life with real telemetry. This is where Odigos completely transforms the experience. Instead of manually instrumenting microservices, modifying code, or redeploying applications, Odigos automatically attaches eBPF powered OpenTelemetry instrumentation to your workloads with just a few clicks. It discovers every service in your cluster, captures traffic, and begins emitting rich, end-to-end traces within minutes. Odigos captures deep insights into requests, dependencies, databases, external calls, and latency hotspots without requiring developers to touch a single line of code.
It does all of this transparently and safely, using eBPF and language-native hooks to generate production-grade spans. The result is full visibility across your microservices from day one, even for legacy or third-party applications that were never instrumented. With Odigos in front of your stack, tracing becomes effortless, consistent, and scalable. This is the moment when your observability pipeline stops being just deployed, and starts delivering value.
Deploy Odigos With Your Enterprise Token
helm repo add odigos https://odigos-io.github.io/odigos/
helm repo update
helm upgrade --install odigos odigos/odigos --namespace odigos-system --create-namespace --set onPremToken=$ODIGOS_TOKEN
Access the UI
kubectl port-forward svc/ui 3000:3000 -n odigos-system
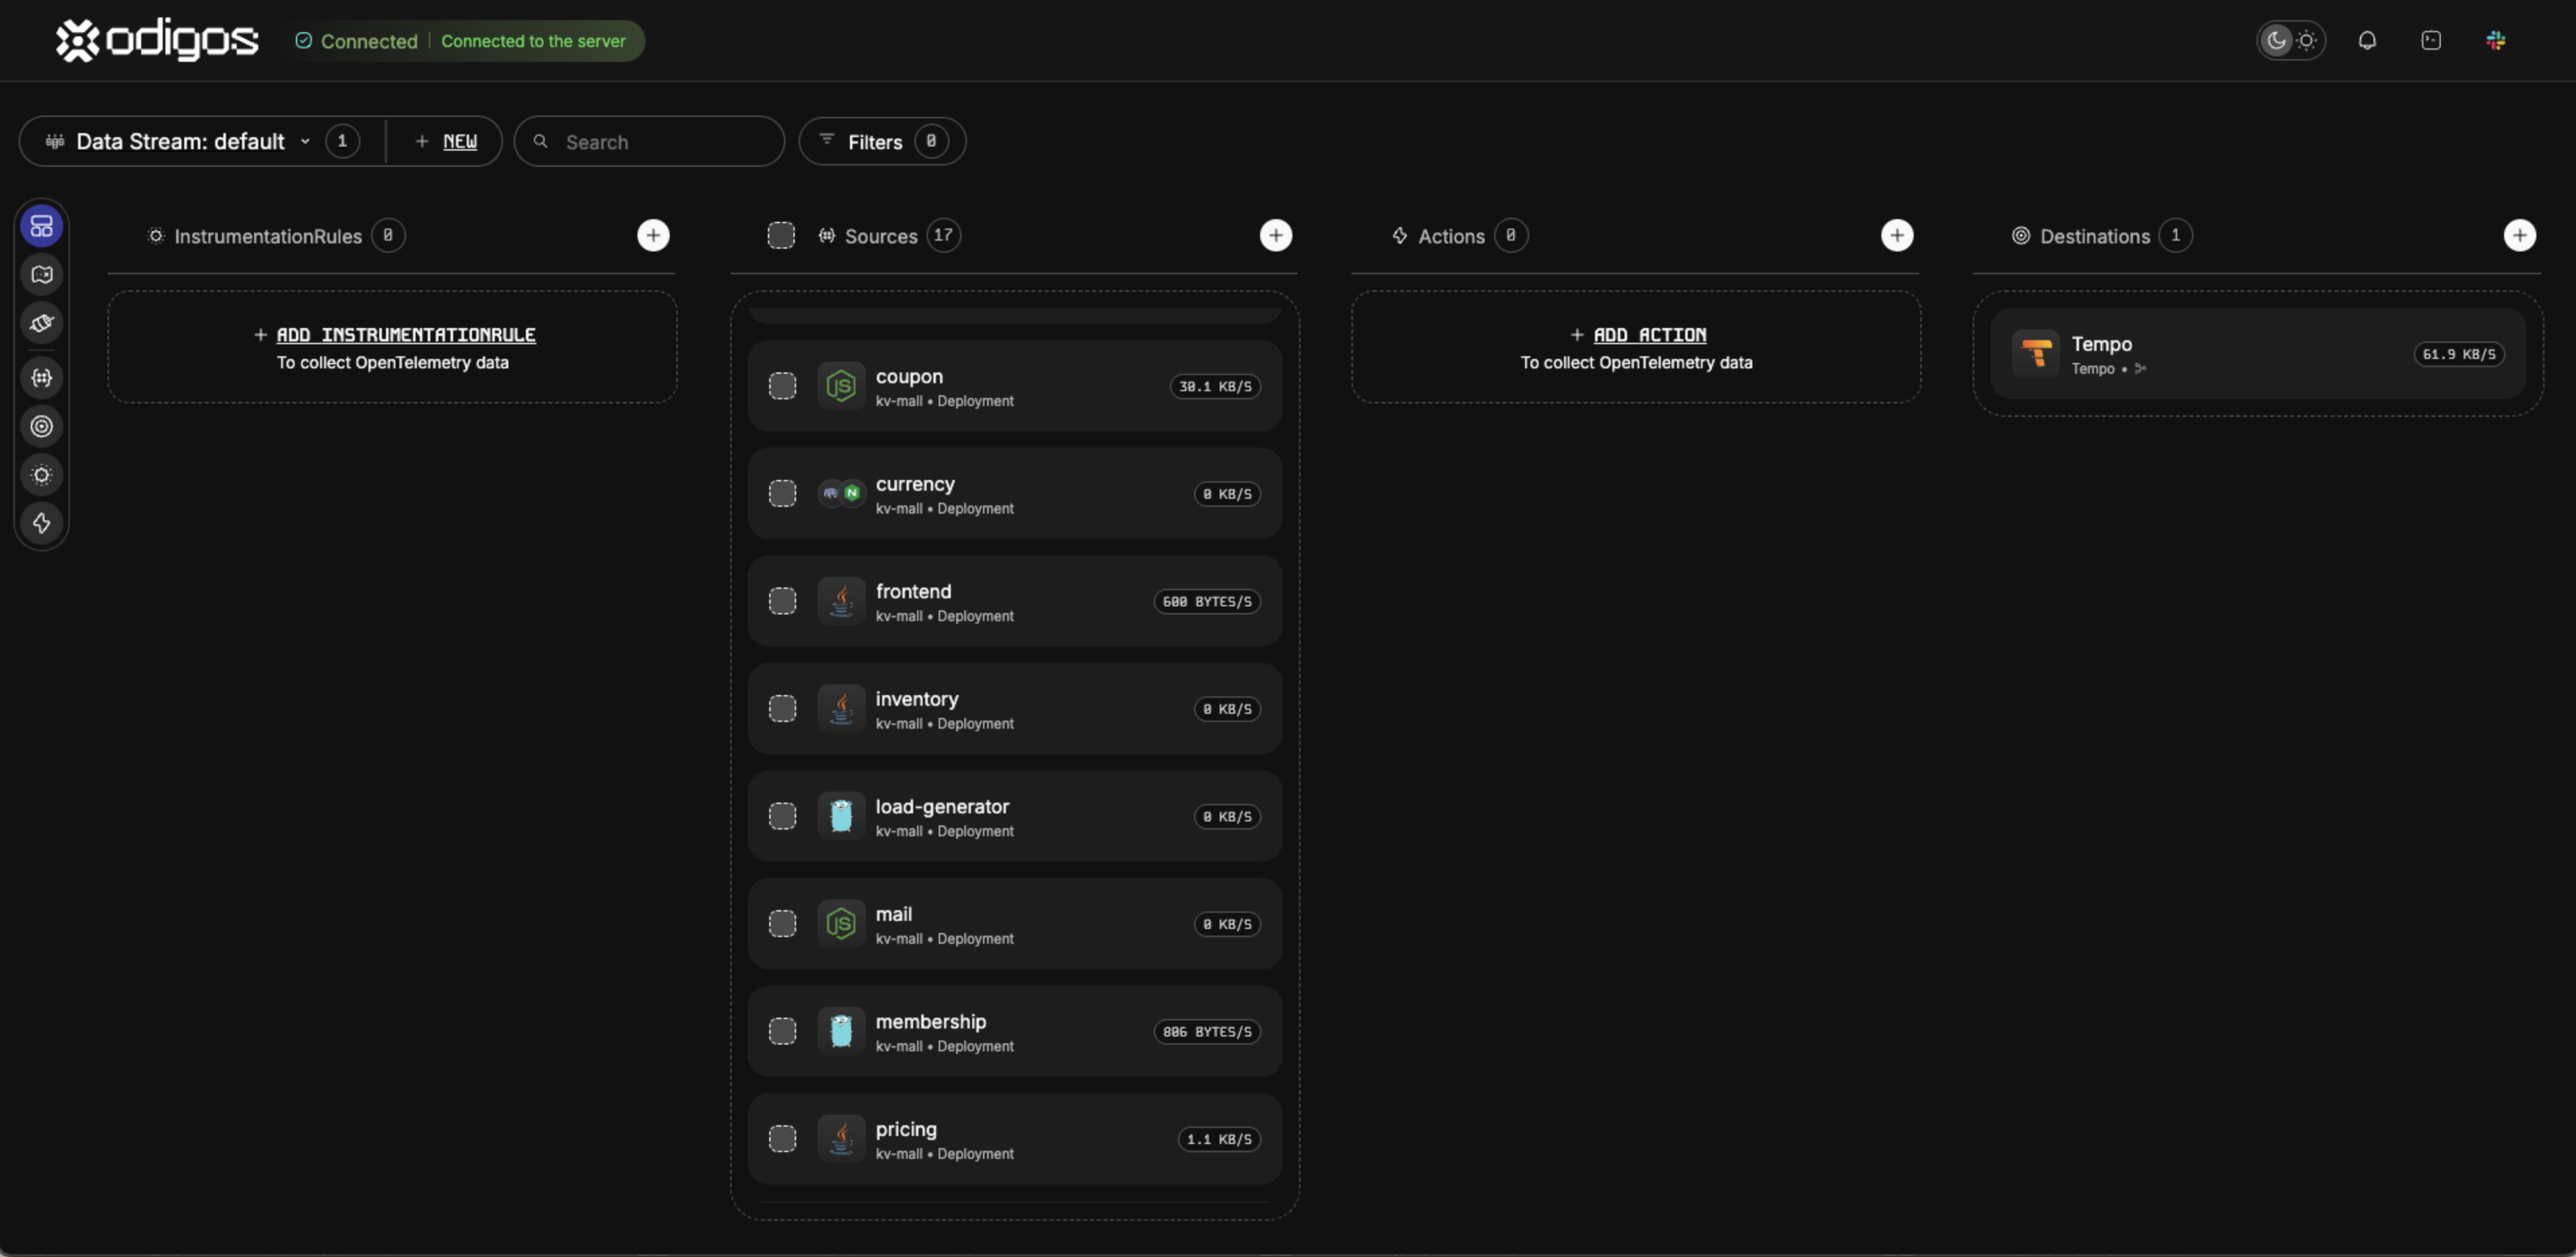
The next step is to select the sources you want to instrument. Odigos will automatically list all the workloads in your cluster, and you can simply pick the microservices you want tracing for. After selecting your sources, add a new destination and choose Tempo. For the endpoint, provide the URL of your Tempo query frontend service, which will receive and store all incoming traces. Within seconds, Odigos will begin streaming data directly into your Grafana Tempo pipeline.
Step 3: Viewing Traces in Grafana
The final step is to connect everything inside Grafana. Add Tempo as a new datasource using the endpoint of your Tempo query frontend service, and Grafana will immediately begin pulling in traces. From here, you can explore full end to end trace flows, drill into RED metrics automatically generated by the metrics generator, and start building dashboards that combine spans, metrics, and service performance in a single view.
In just a few minutes, you’ve assembled a production grade tracing platform powered entirely by open source components and instrumented automatically with deep telemetry from Odigos. The result is enterprise level observability without enterprise level cost, delivering actionable insights faster than traditional APM solutions could even be deployed.
More from the blog.



Stop guessing. Ask production.
One agent. One service. See how Odigos helps answer a production question.