
How Odigos Simplifies Authentication with Google Cloud Observability
Learn about new features in Odigos GCP Destinations
Odigos and Google Cloud
Odigos provides connections to over 60 different observability backends, allowing you the flexibility not only to instrument your applications easily, but also to route that instrumentation to any major backend. Today we'll dive into one of those backends and how Odigos improves that experience: Google Cloud Observability.
GCP Observability and OpenTelemetry
Google Cloud offers observability backends for logs, metrics, and traces with their Cloud Logging, Cloud Monitoring, and Cloud Trace products. Each of these products has a different recommended manual instrumentation approach depending on the GCP environment in which you are running.
Fortunately, OpenTelemetry unifies these approaches into a common component. Like many Odigos destinations, the Google Cloud OpenTelemetry Collector Exporter handles the critical conversion of OpenTelemetry Protocol (OTLP) data to the proprietary Google backend API formats.
Manual Instrumentation and GCP
Manual OpenTelemetry instrumentation (writing code to explicitly report telemetry) works directly with the Google Cloud backend by combining the OpenTelemetry SDK and Google Cloud specific exporters. For example, in Go the OpenTelemetry Go SDK can be configured with the Google Cloud Trace SDK exporter. Note that this process is different for every language, and there is limited language support.
In practice, though, many use cases benefit from using the native OTLP SDK (or auto-instrumentation) with an OpenTelemetry Collector to process and route telemetry.
Using the OpenTelemetry Collector with GCP
When deploying and configuring the OpenTelemetry Collector yourself for Google Cloud, the preferred path is, of course, to be running your workloads on GCP. Google provides documentation for how to deploy their own build of the OpenTelemetry Collector on GKE, a guide on using the Ops Agent (a Google tool partially built on the OpenTelemetry Collector) on GCE, a sample GitHub repo demonstrating how to use the Collector with their OTLP-based Telemetry API, and even examples of how to send metrics from Cloud Run using a Collector sidecar.
However, there are few guides on how to use the Collector with Google Cloud Observability when instrumenting workloads outside of GCP (such as on bare metal, another cloud provider, or even locally for development). If you've tried to set up any of these approaches, you have likely hit some common pain points.
Authenticating Off-GCP Workloads
The biggest challenge with connecting off-GCP workloads in Cloud Observability is authentication. Google's OpenTelemetry exporter relies on Application Default Credentials (ADC) to inject the necessary authentication headers into your Google API requests.
ADC looks in known locations for a
credentials file
or in a location set by the GOOGLE_APPLICATION_CREDENTIALS environment variable. If neither of
these is set, it will fall back to the
GCP Service Account attached to the Collector workload.
These three options are only available by default when running inside Google Cloud. So how can Cloud Observability work in a multi-cloud or hybrid cloud architecture?
There is a guide in the README of the GCP exporter that discusses this option, which in Kubernetes ultimately comes down to:
- Create a Service Account token
- Create a Kubernetes Secret containing the token file data
- Mount the Secret into your Collector Pod
- Inject the
GOOGLE_APPLICATION_CREDENTIALSenvironment variable to point to the mounted Secret location - Set the
projectCollector config option to your destination GCP project
This workflow is difficult to scale and even tools like the OpenTelemetry Operator don't offer a way to customize Collector deployments to include the necessary volume mounts and environment variables.
How Odigos Helps
Connecting to Google Cloud from Odigos is done with a single Destination. When running Odigos on GKE, no configuration is required; the Destination can be created with a single click in the UI.
For authenticating off-GCP, the Application Credentials field accepts a full GCP Service Account token or Workload Identity file. Under the hood, Odigos handles the creation and injection of this secret into the Collector.
You can also manage the secret yourself (for example, if using an external secrets manager), and
create the Google Cloud Destination via Kubernetes YAML manifest using the SecretRef field:
apiVersion: odigos.io/v1alpha1
kind: Destination
metadata:
  name: googlecloud-example
  namespace: odigos-system
spec:
  data: {}
  destinationName: googlecloud
  secretRef:
    name: googlecloud-secret
  signals:
  - TRACES
  type: googlecloud
Google Cloud and OTLP
In contrast with the Google Cloud exporter, which uses the Cloud Trace proprietary API (and therefore translates OTLP telemetry to GCP's API format), the GCP Telemetry API mentioned earlier consumes OpenTelemetry's standard OTLP format directly. This makes it possible to use a standard OTLP exporter with a Collector. Availability for the Telemetry API was recently announced, which provides great flexibility for users by demonstrating Google's support for OpenTelemetry's industry standard format.
However, this solution also brings the challenge of proper authentication, even when running on GCP!
This is because, unlike the Google Cloud exporter, the OTLP exporter has no built-in knowledge of Application Default Credentials. Instead, it requires enabling and configuring the Google Client Auth Extension for the OpenTelemetry Collector.
This extension essentially isolates the Google Cloud exporter's ADC logic and injects the required auth info into headers in the OTLP output from the Collector.
The Google Client Auth extension is fairly easy to configure, requiring no values by default when running on GCP.
Again, however, fields such as project are required when running outside of GCP, as well as all of
the same steps to mount a Service Account token mentioned above for the Google Cloud exporter. In addition,
exporting to the Telemetry API OTLP endpoint requires that the gcp.project_id attribute is set on all spans.
When using manual SDK instrumentation, there are even more steps required to import the Google Cloud exporter as a dependency and configure the right environment variables. Again, these steps are different for each language and require configuring Google-specific settings in your application code.
Odigos conveniently supports the same amount of automatic configuration with our new Google Cloud OTLP destination. Simply enable this destination in the Odigos UI and provide the required auth details (token and project ID), and everything else, including the auth extension, will be configured for you.
Walkthrough: Configuring GCP Service Account with Odigos
This guide offers a brief example of configuring a Service Account key to run Odigos outside of GCP. While using a Service Account key is not always recommended, similar approaches can be taken for other GCP credentials providers.
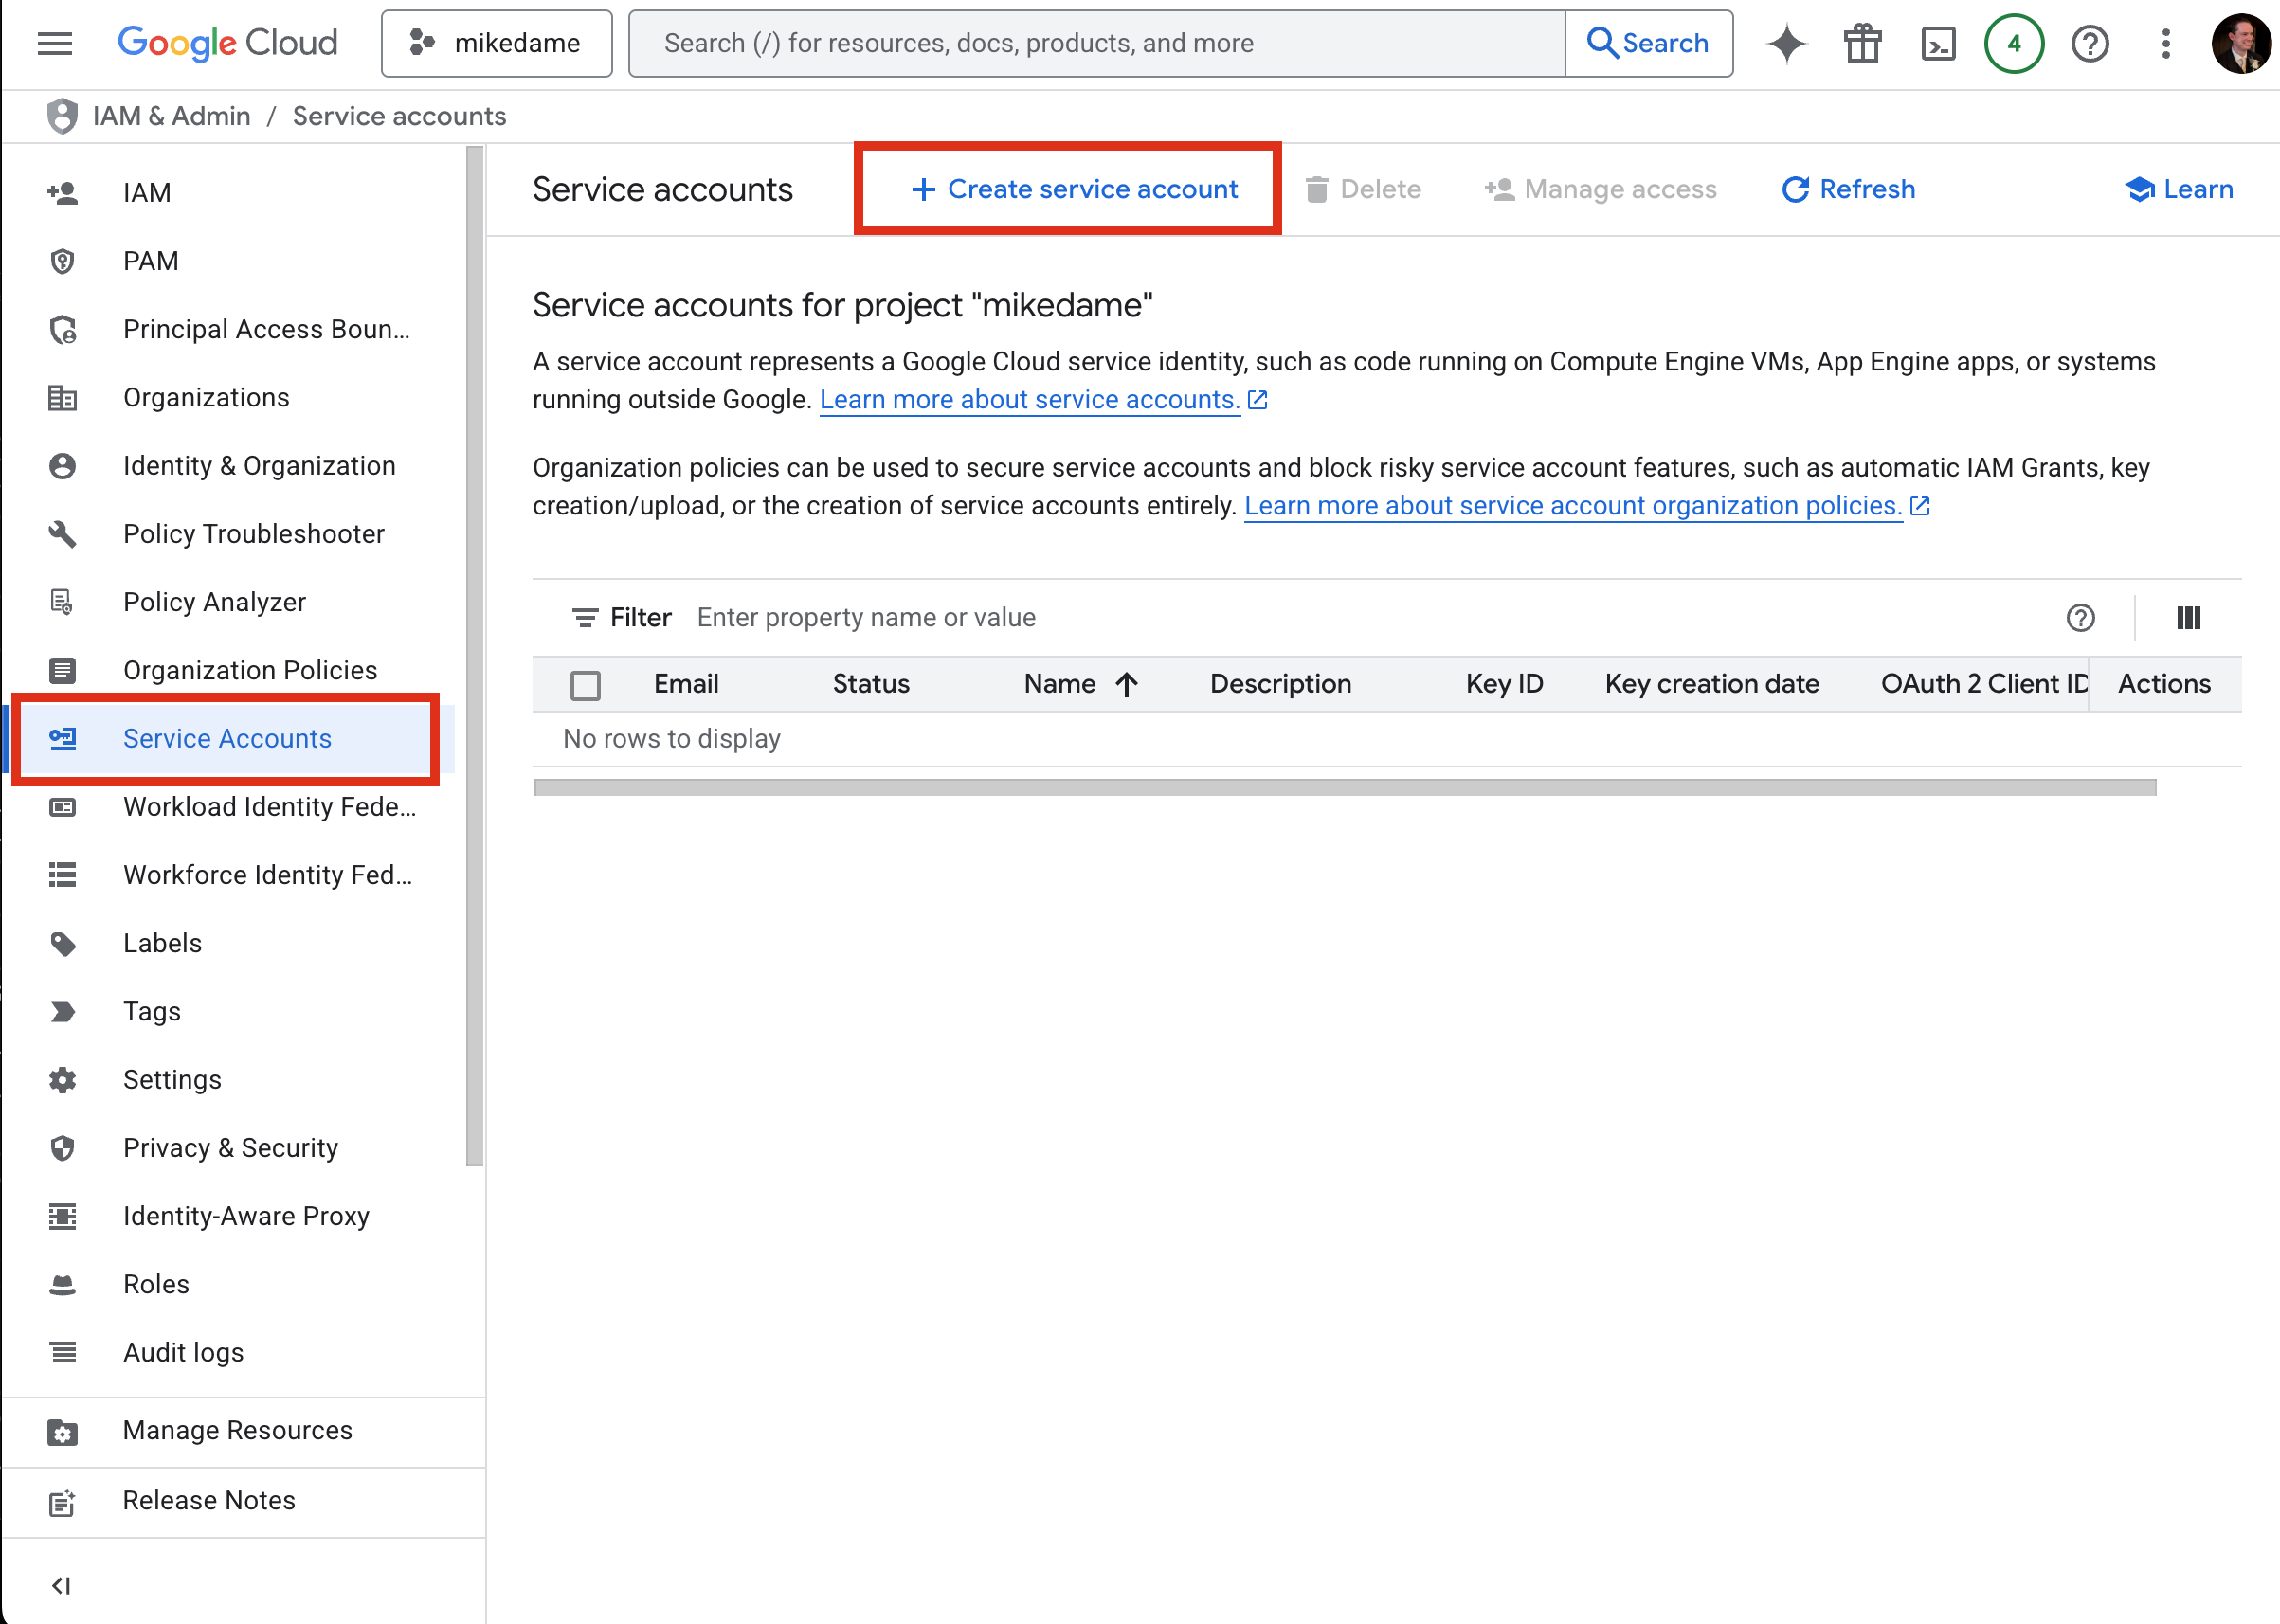
First, create a Service Account in the GCP console by going to Service Accounts and clicking Create Service Account:
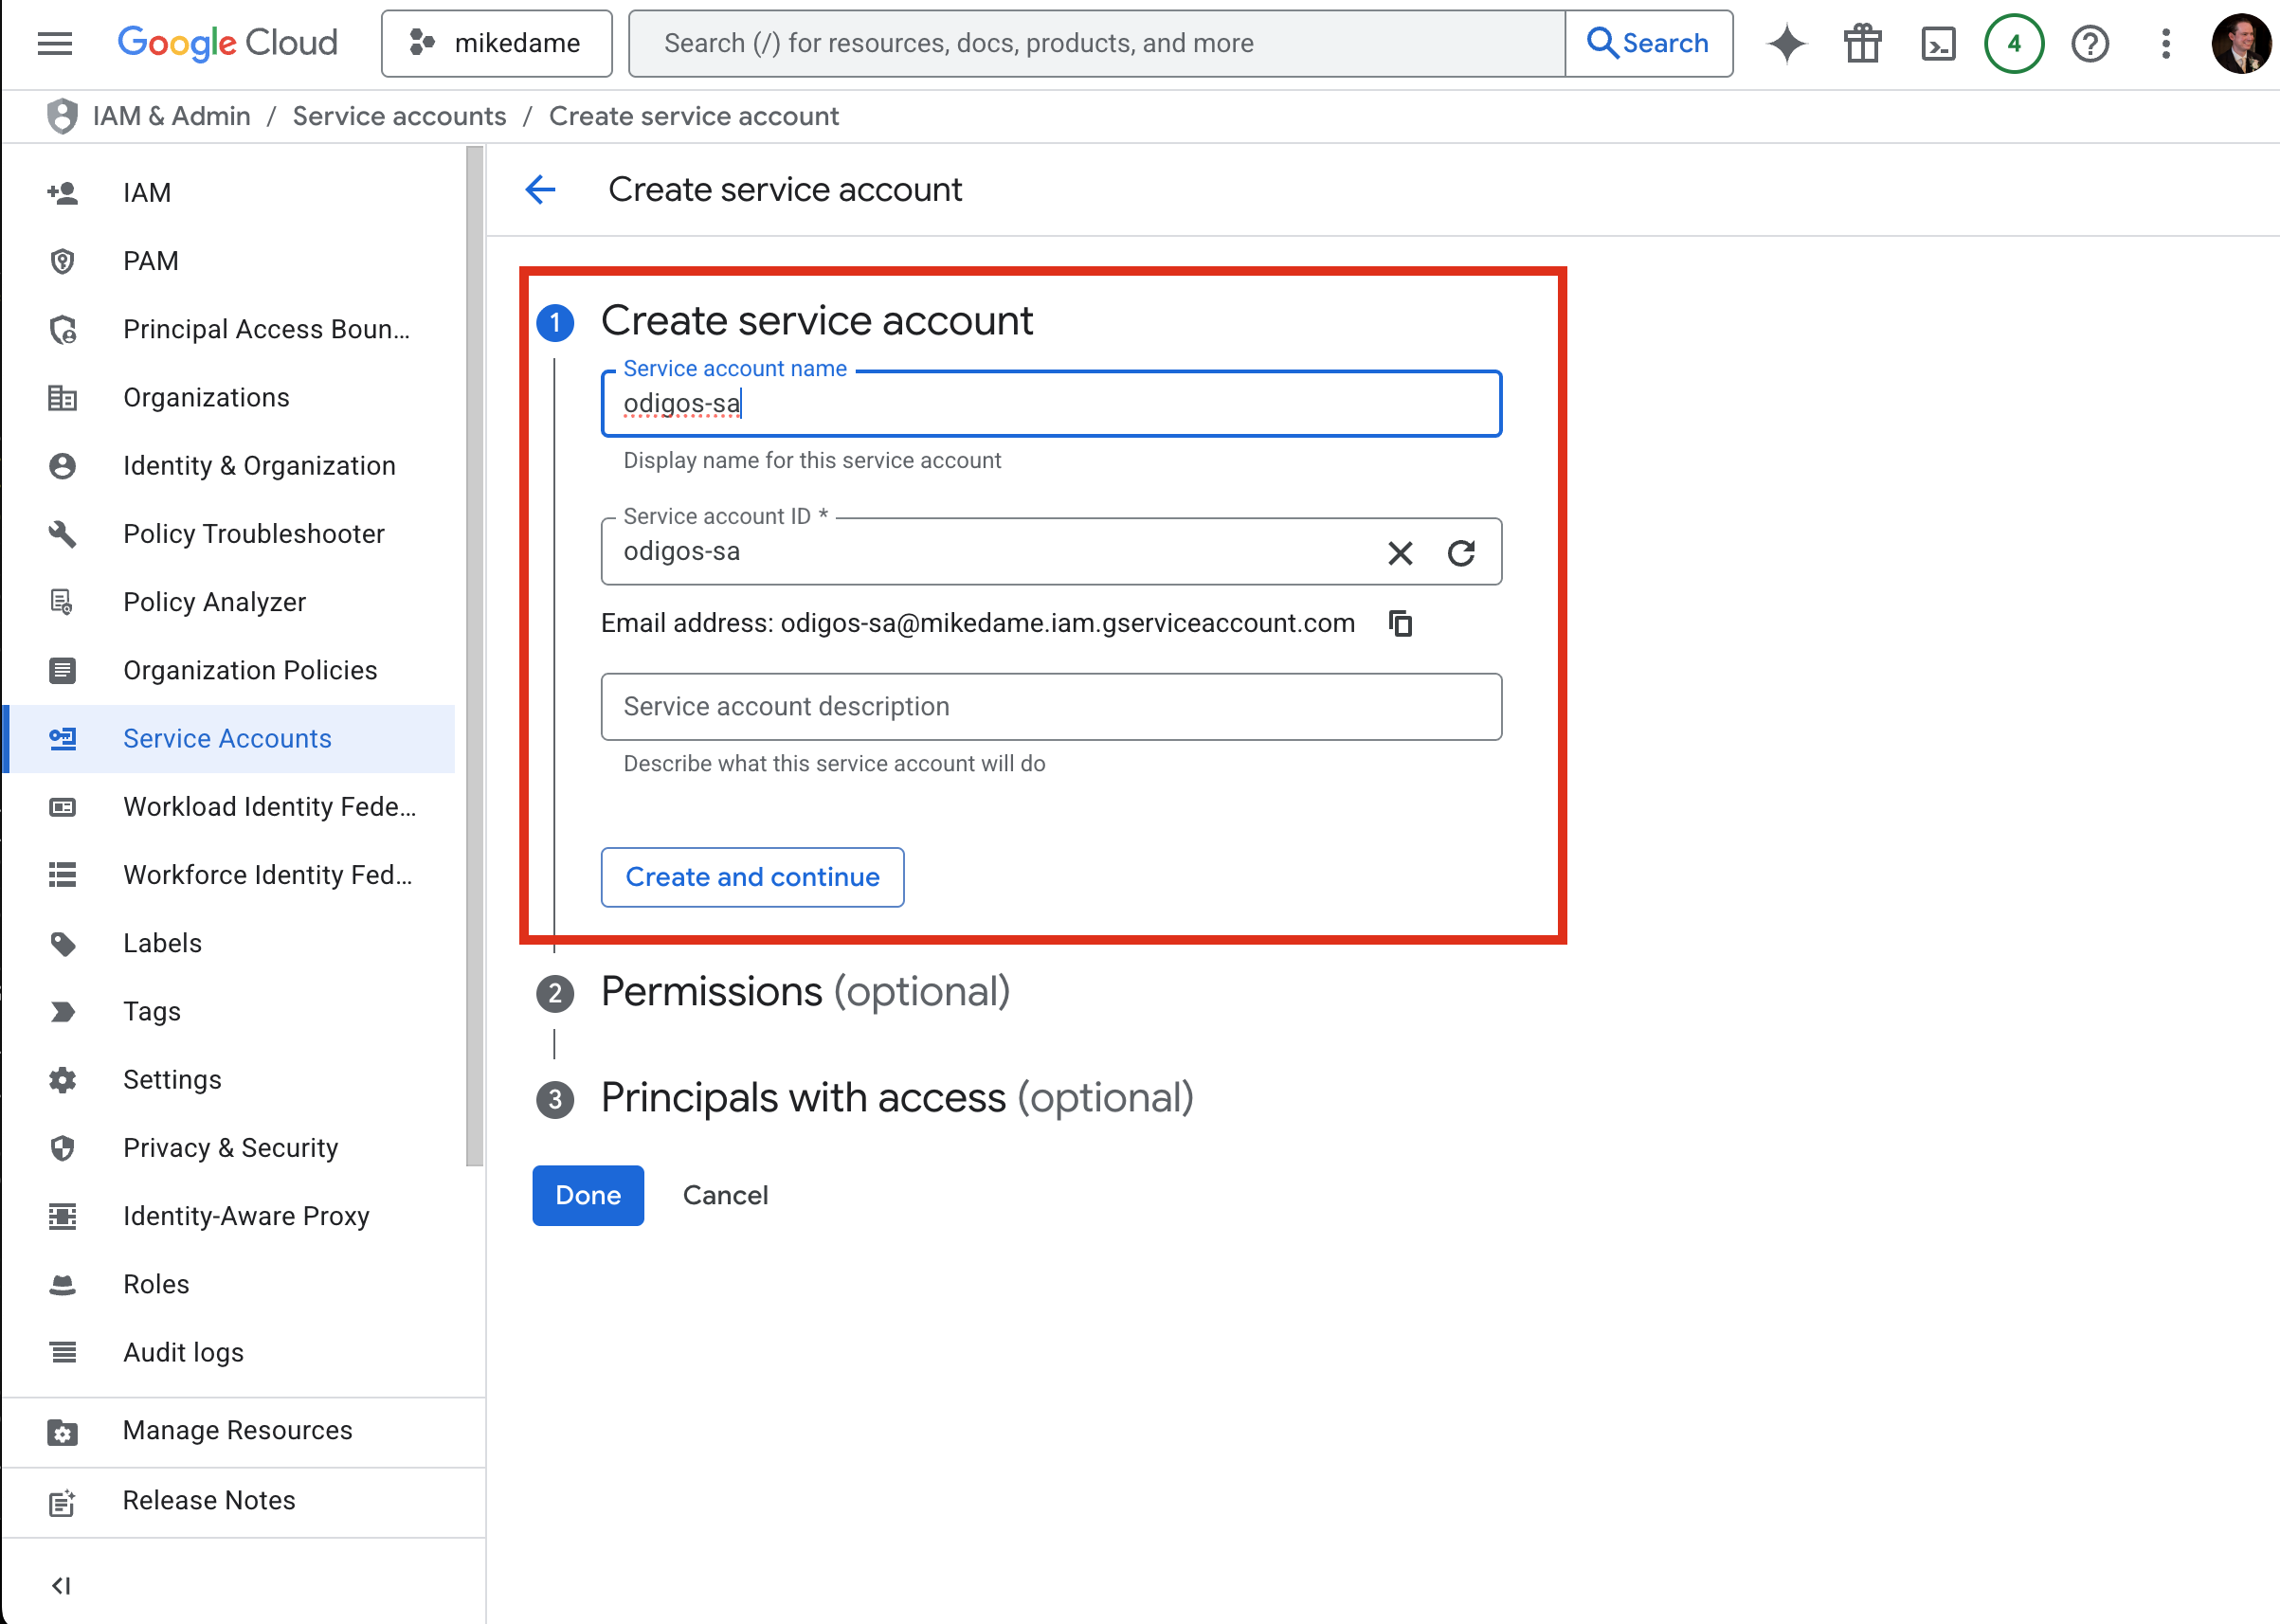
Next, give the Service Account a name and click Create and Continue:
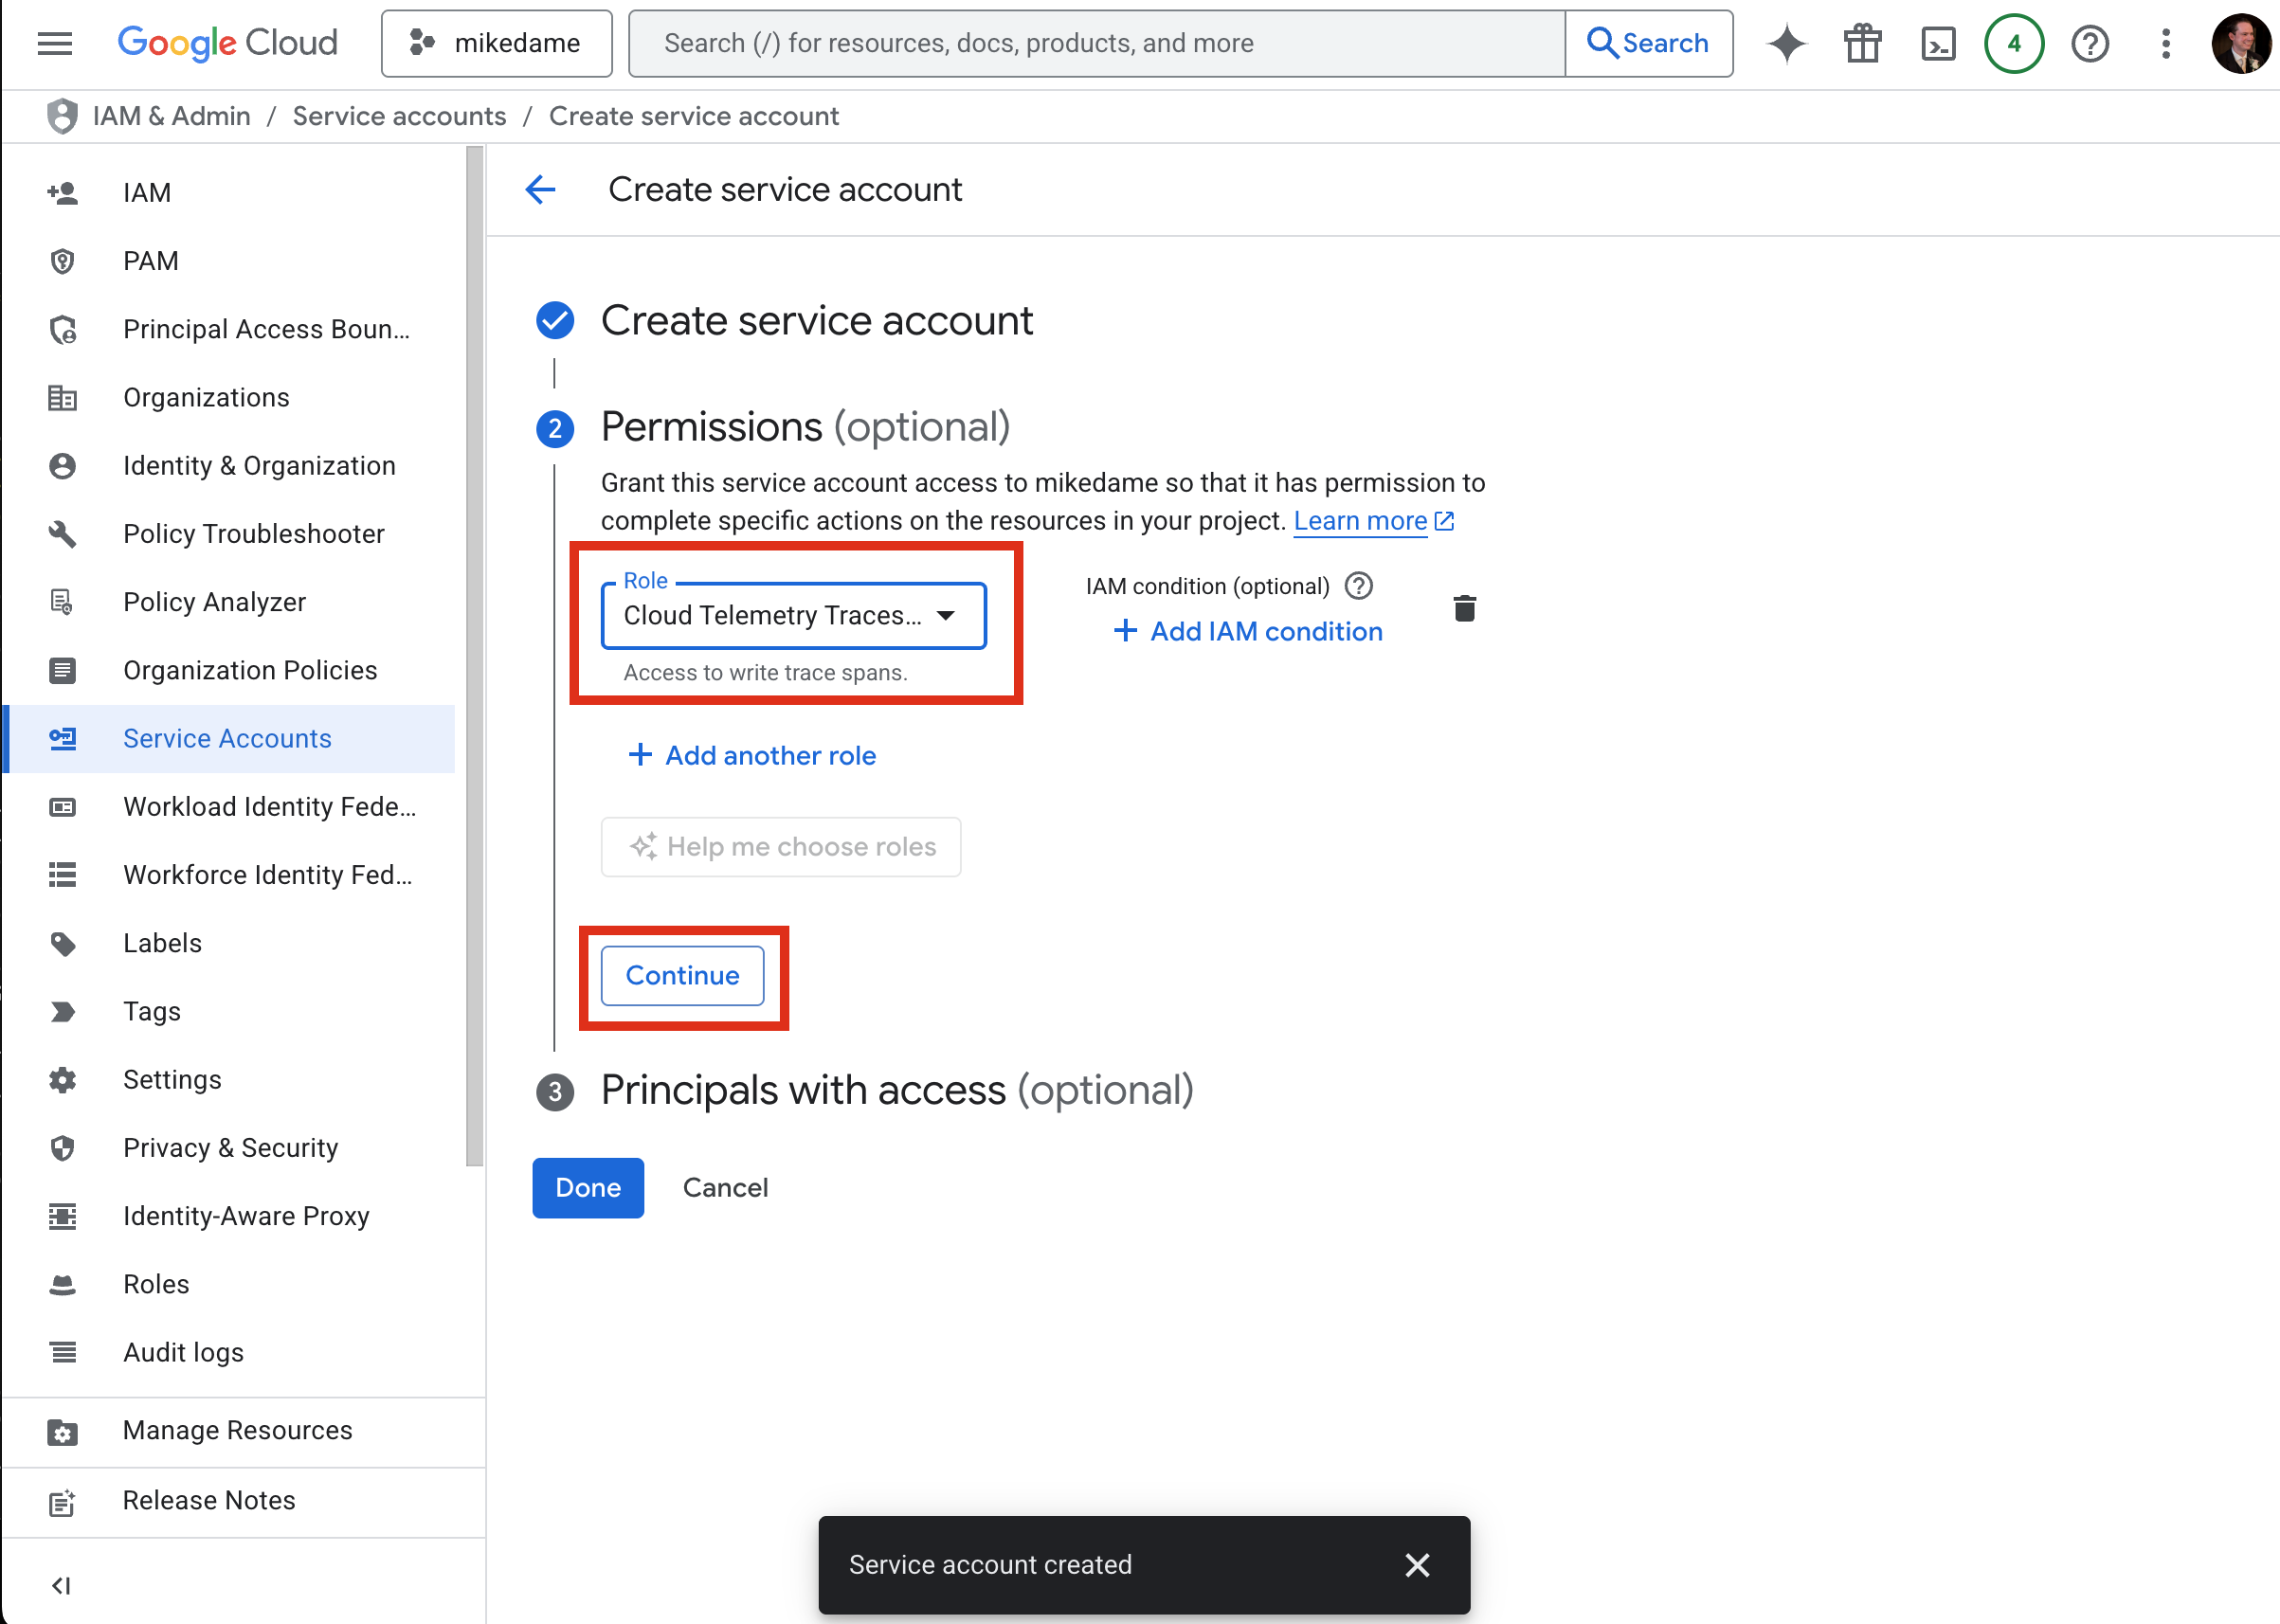
Grant the Service Account the required permissions for the GCP Observability API you're using, such as Cloud Telemetry Traces Writer for the Telemetry (OTLP) API or Cloud Trace Admin for the Cloud Trace API:
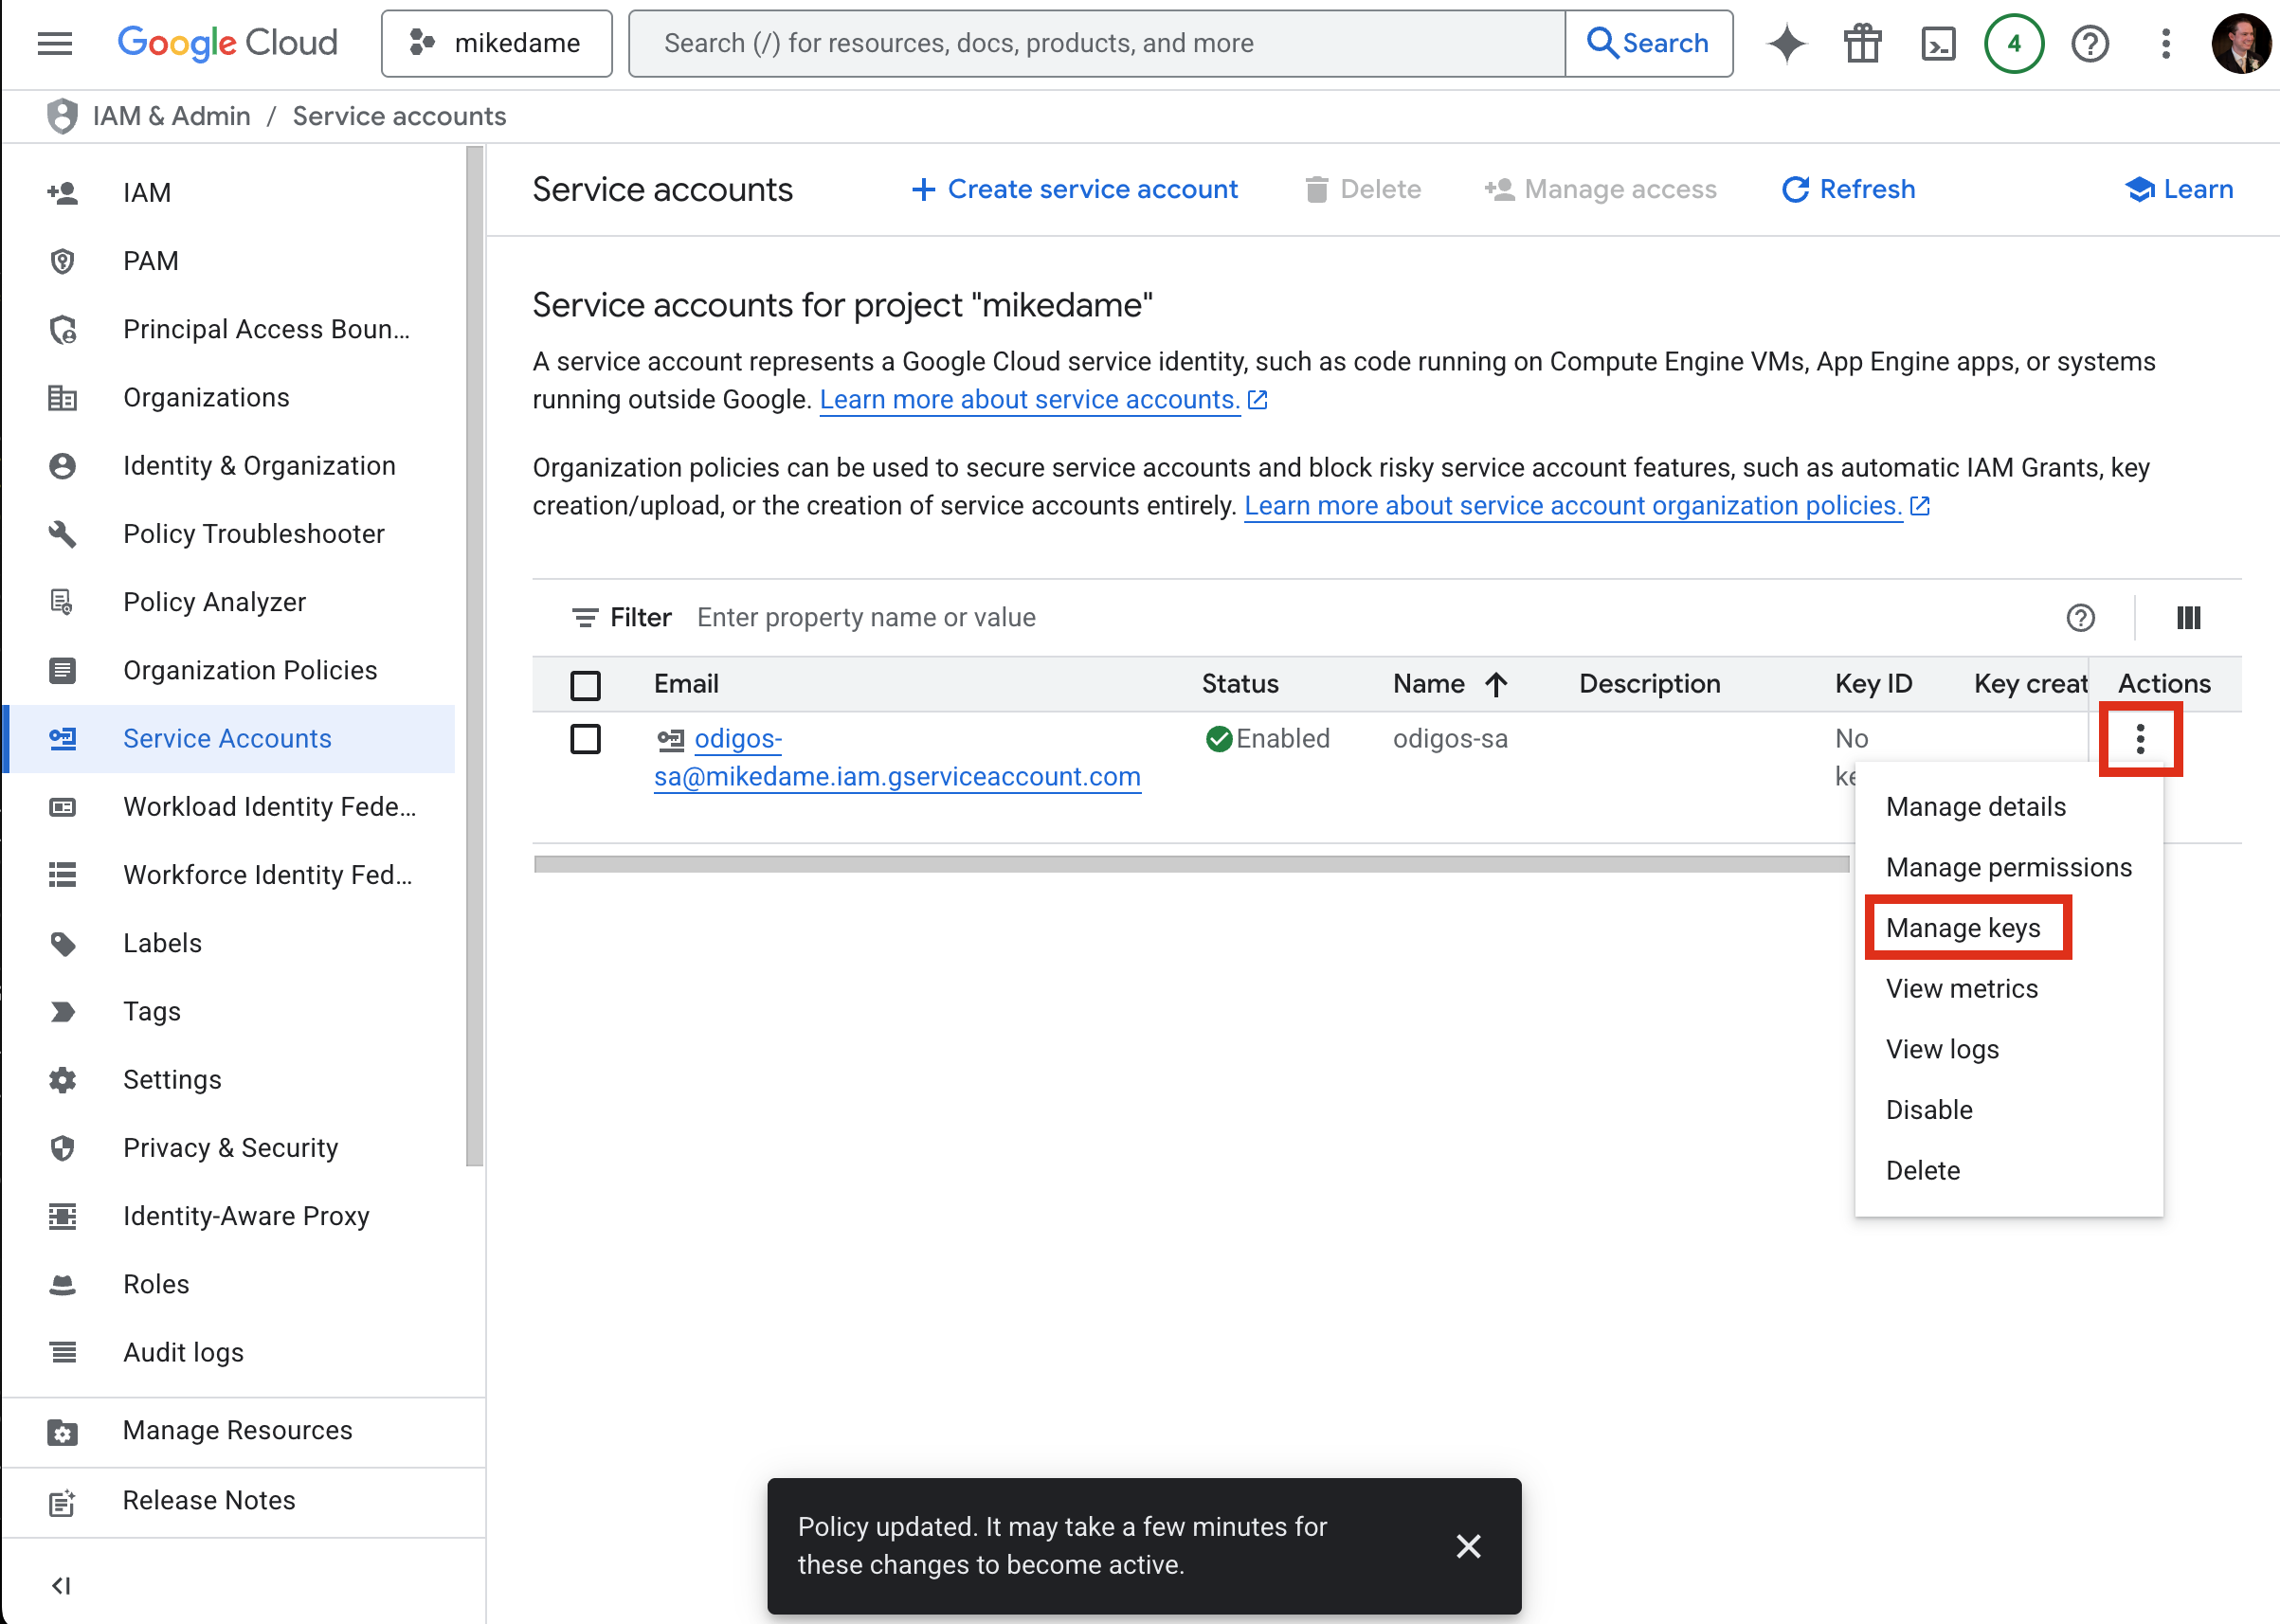
Once the Service Account is created, expand the menu to the right of the Service Account and click Manage Keys:
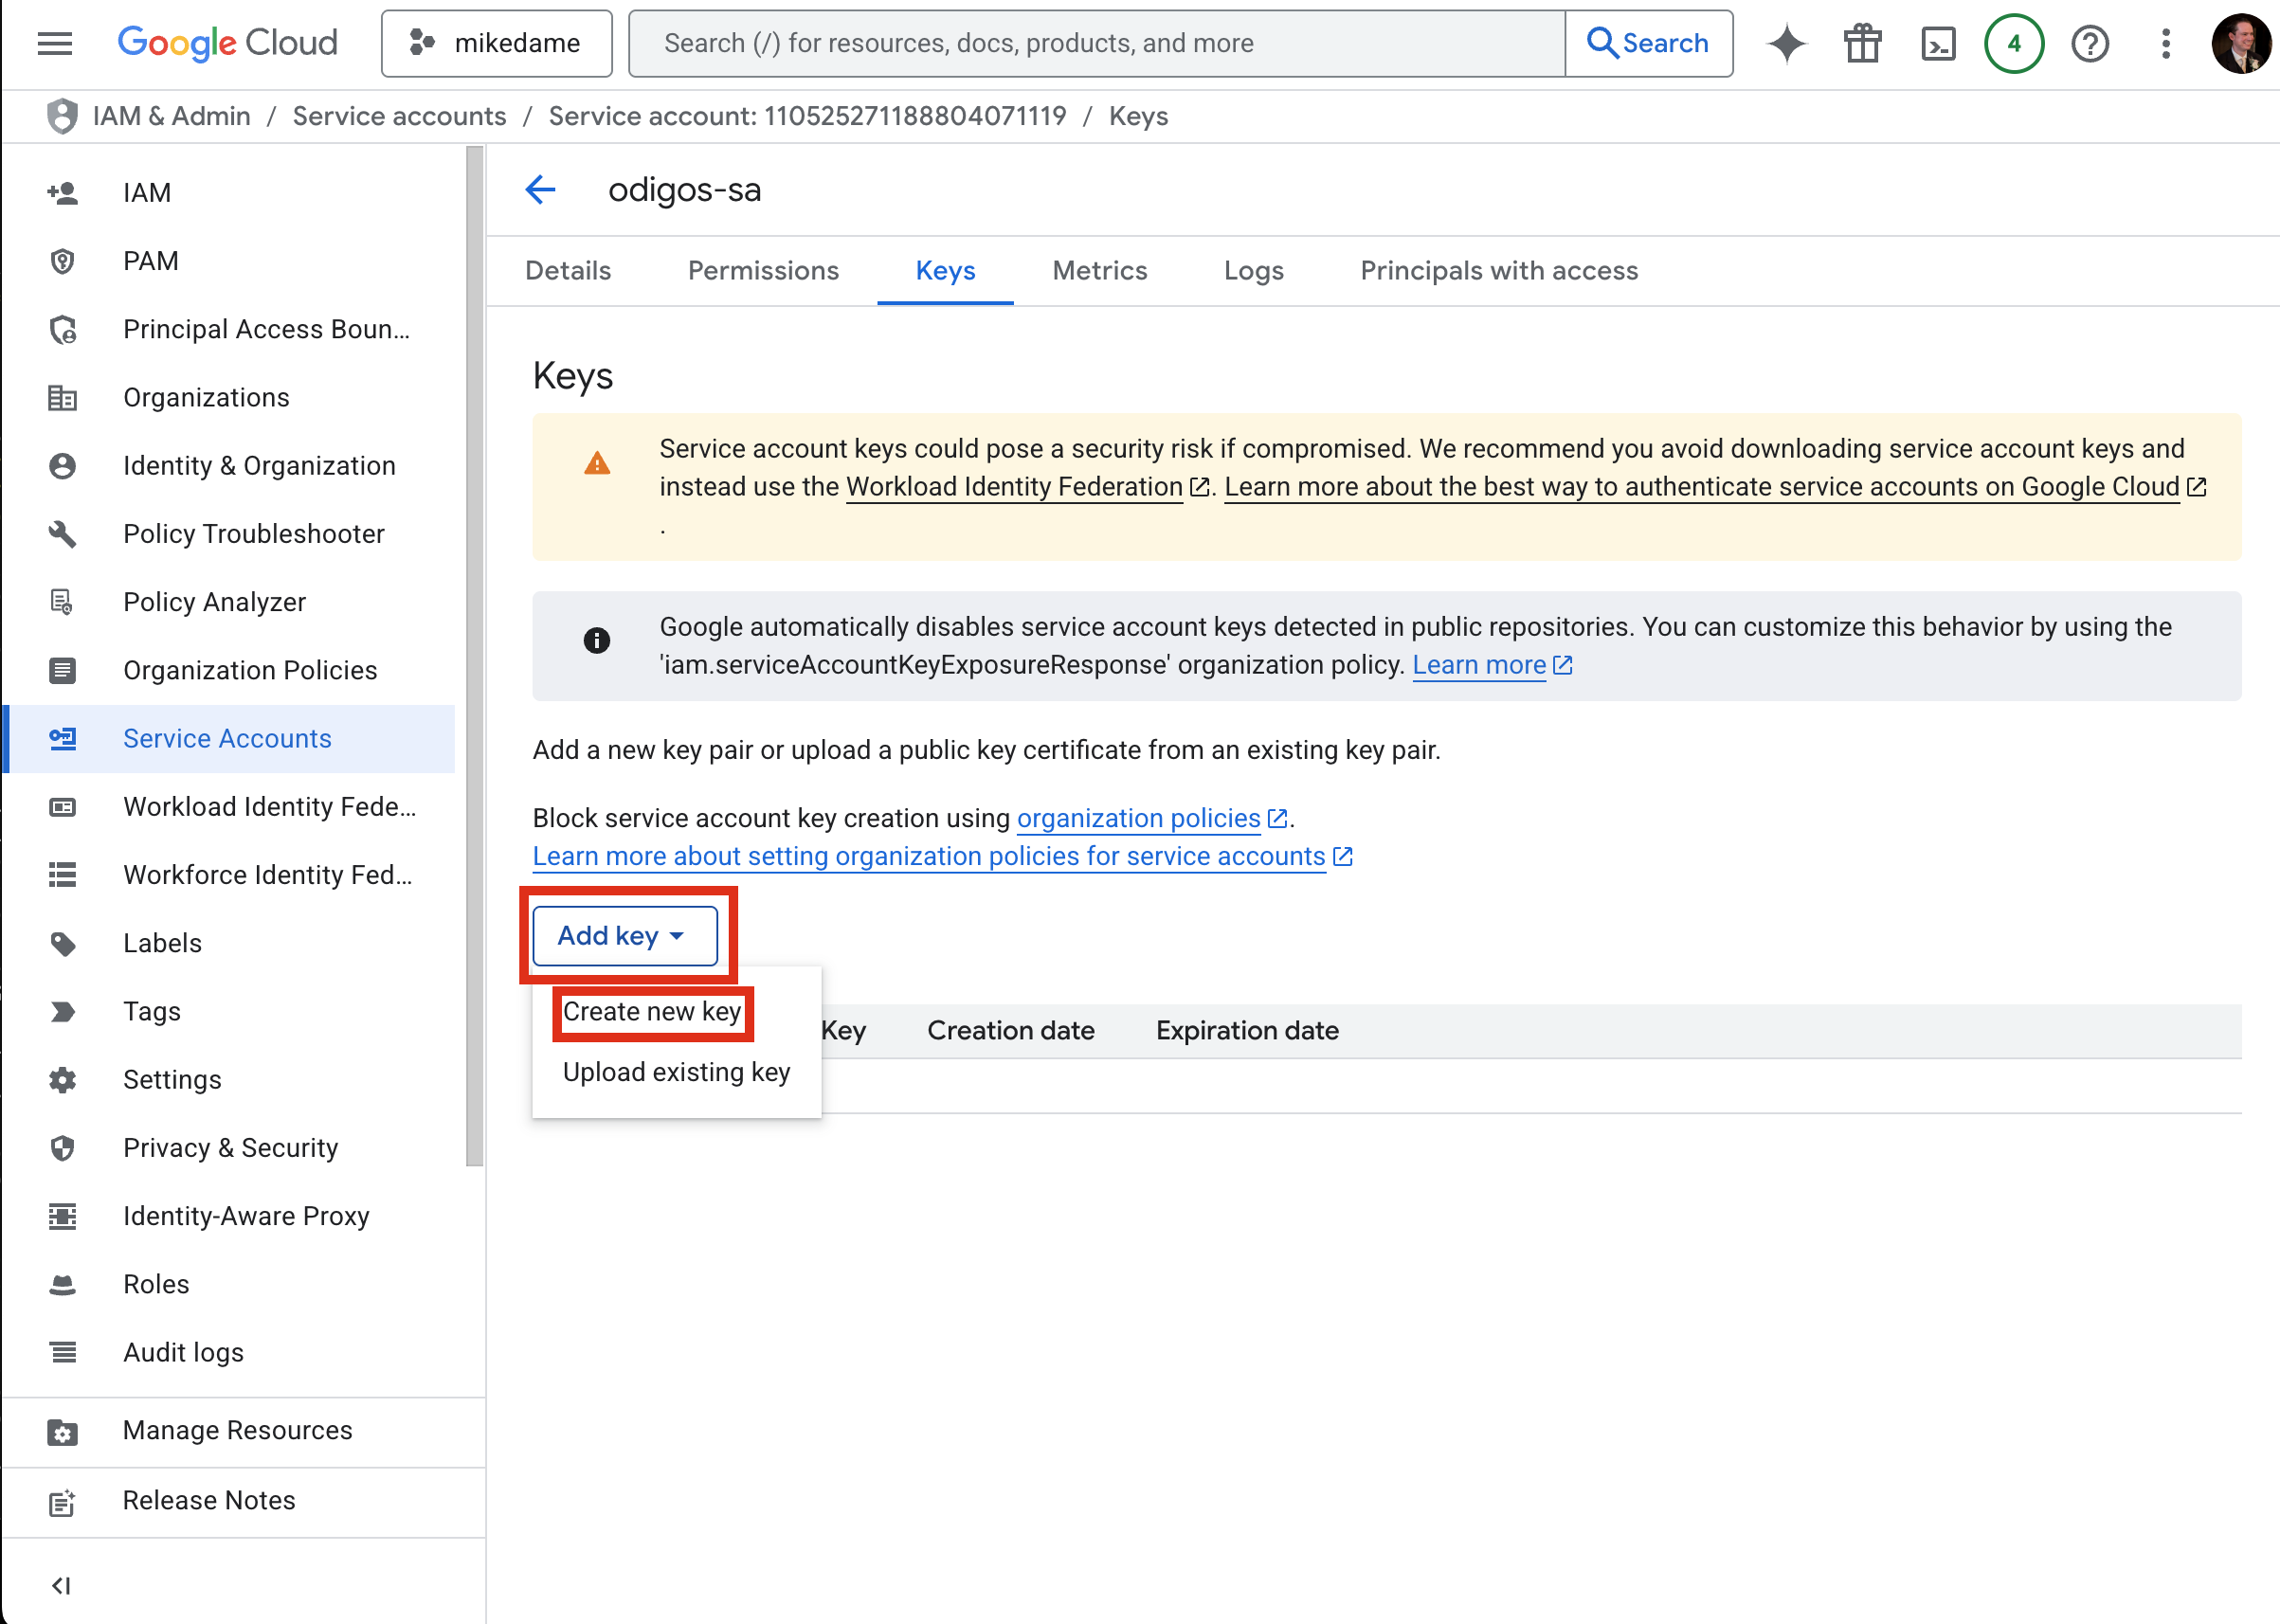
Click Add Key and Create new key:
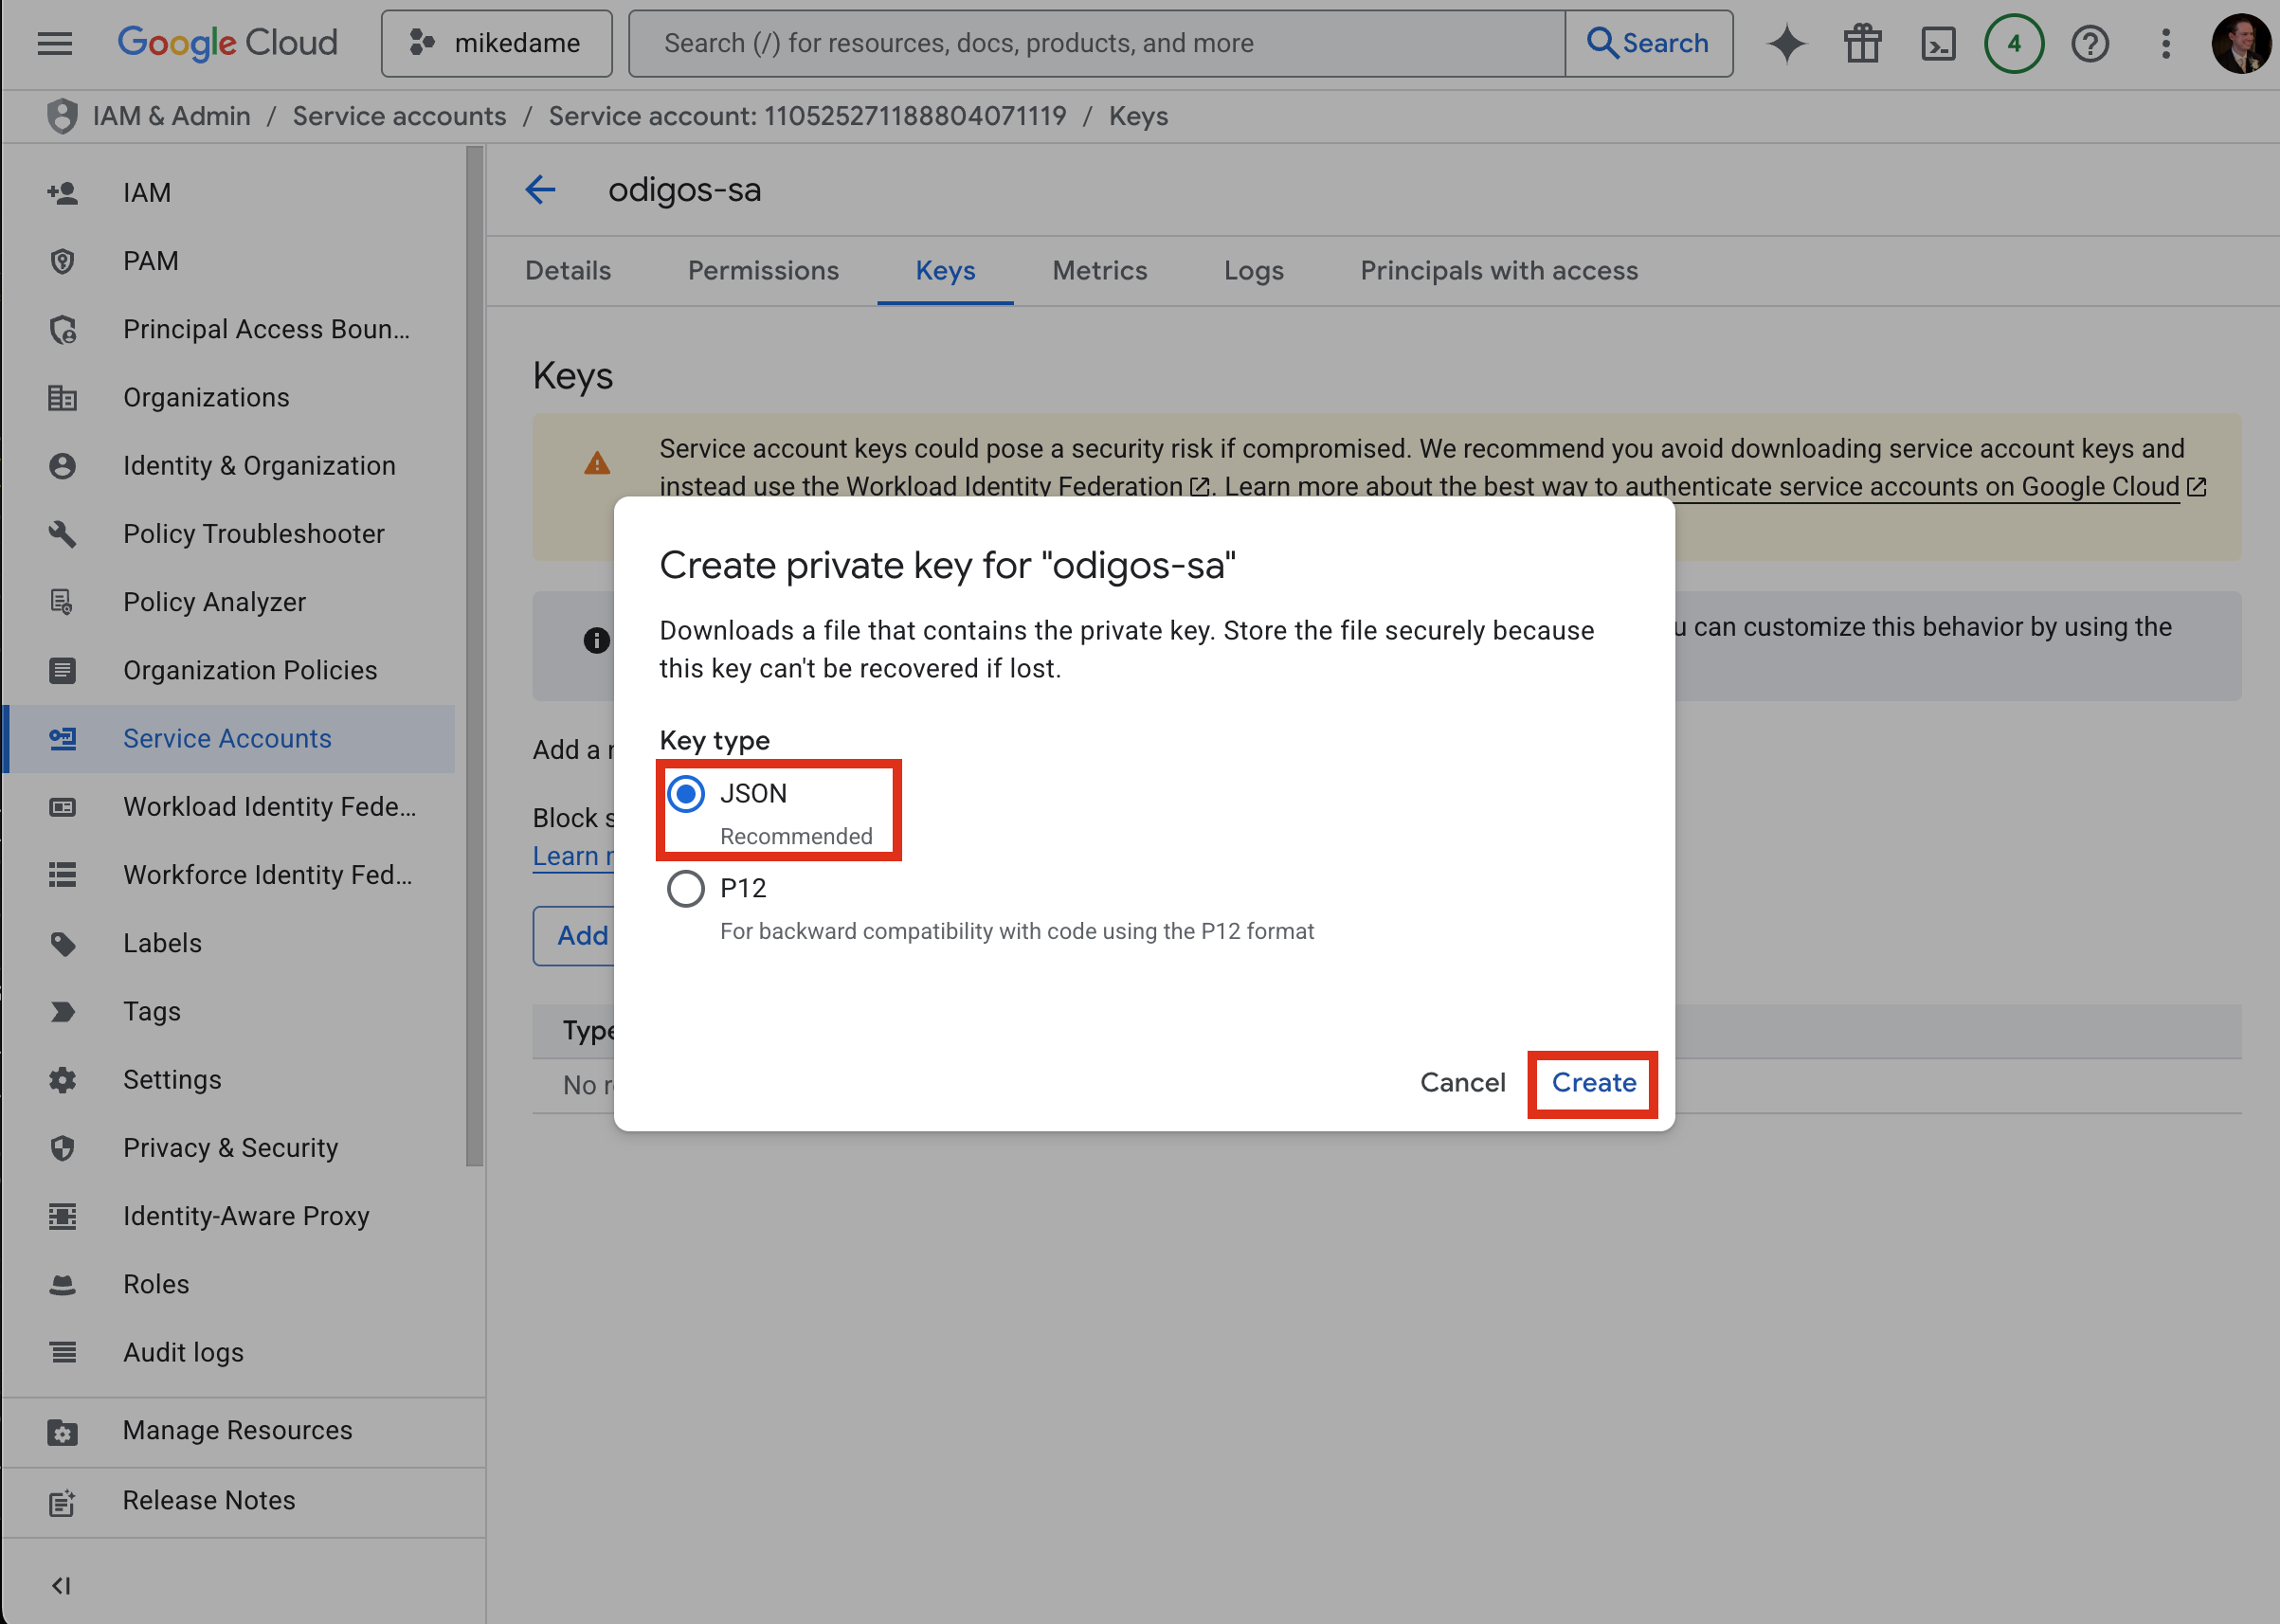
Choose the default JSON and click Create:
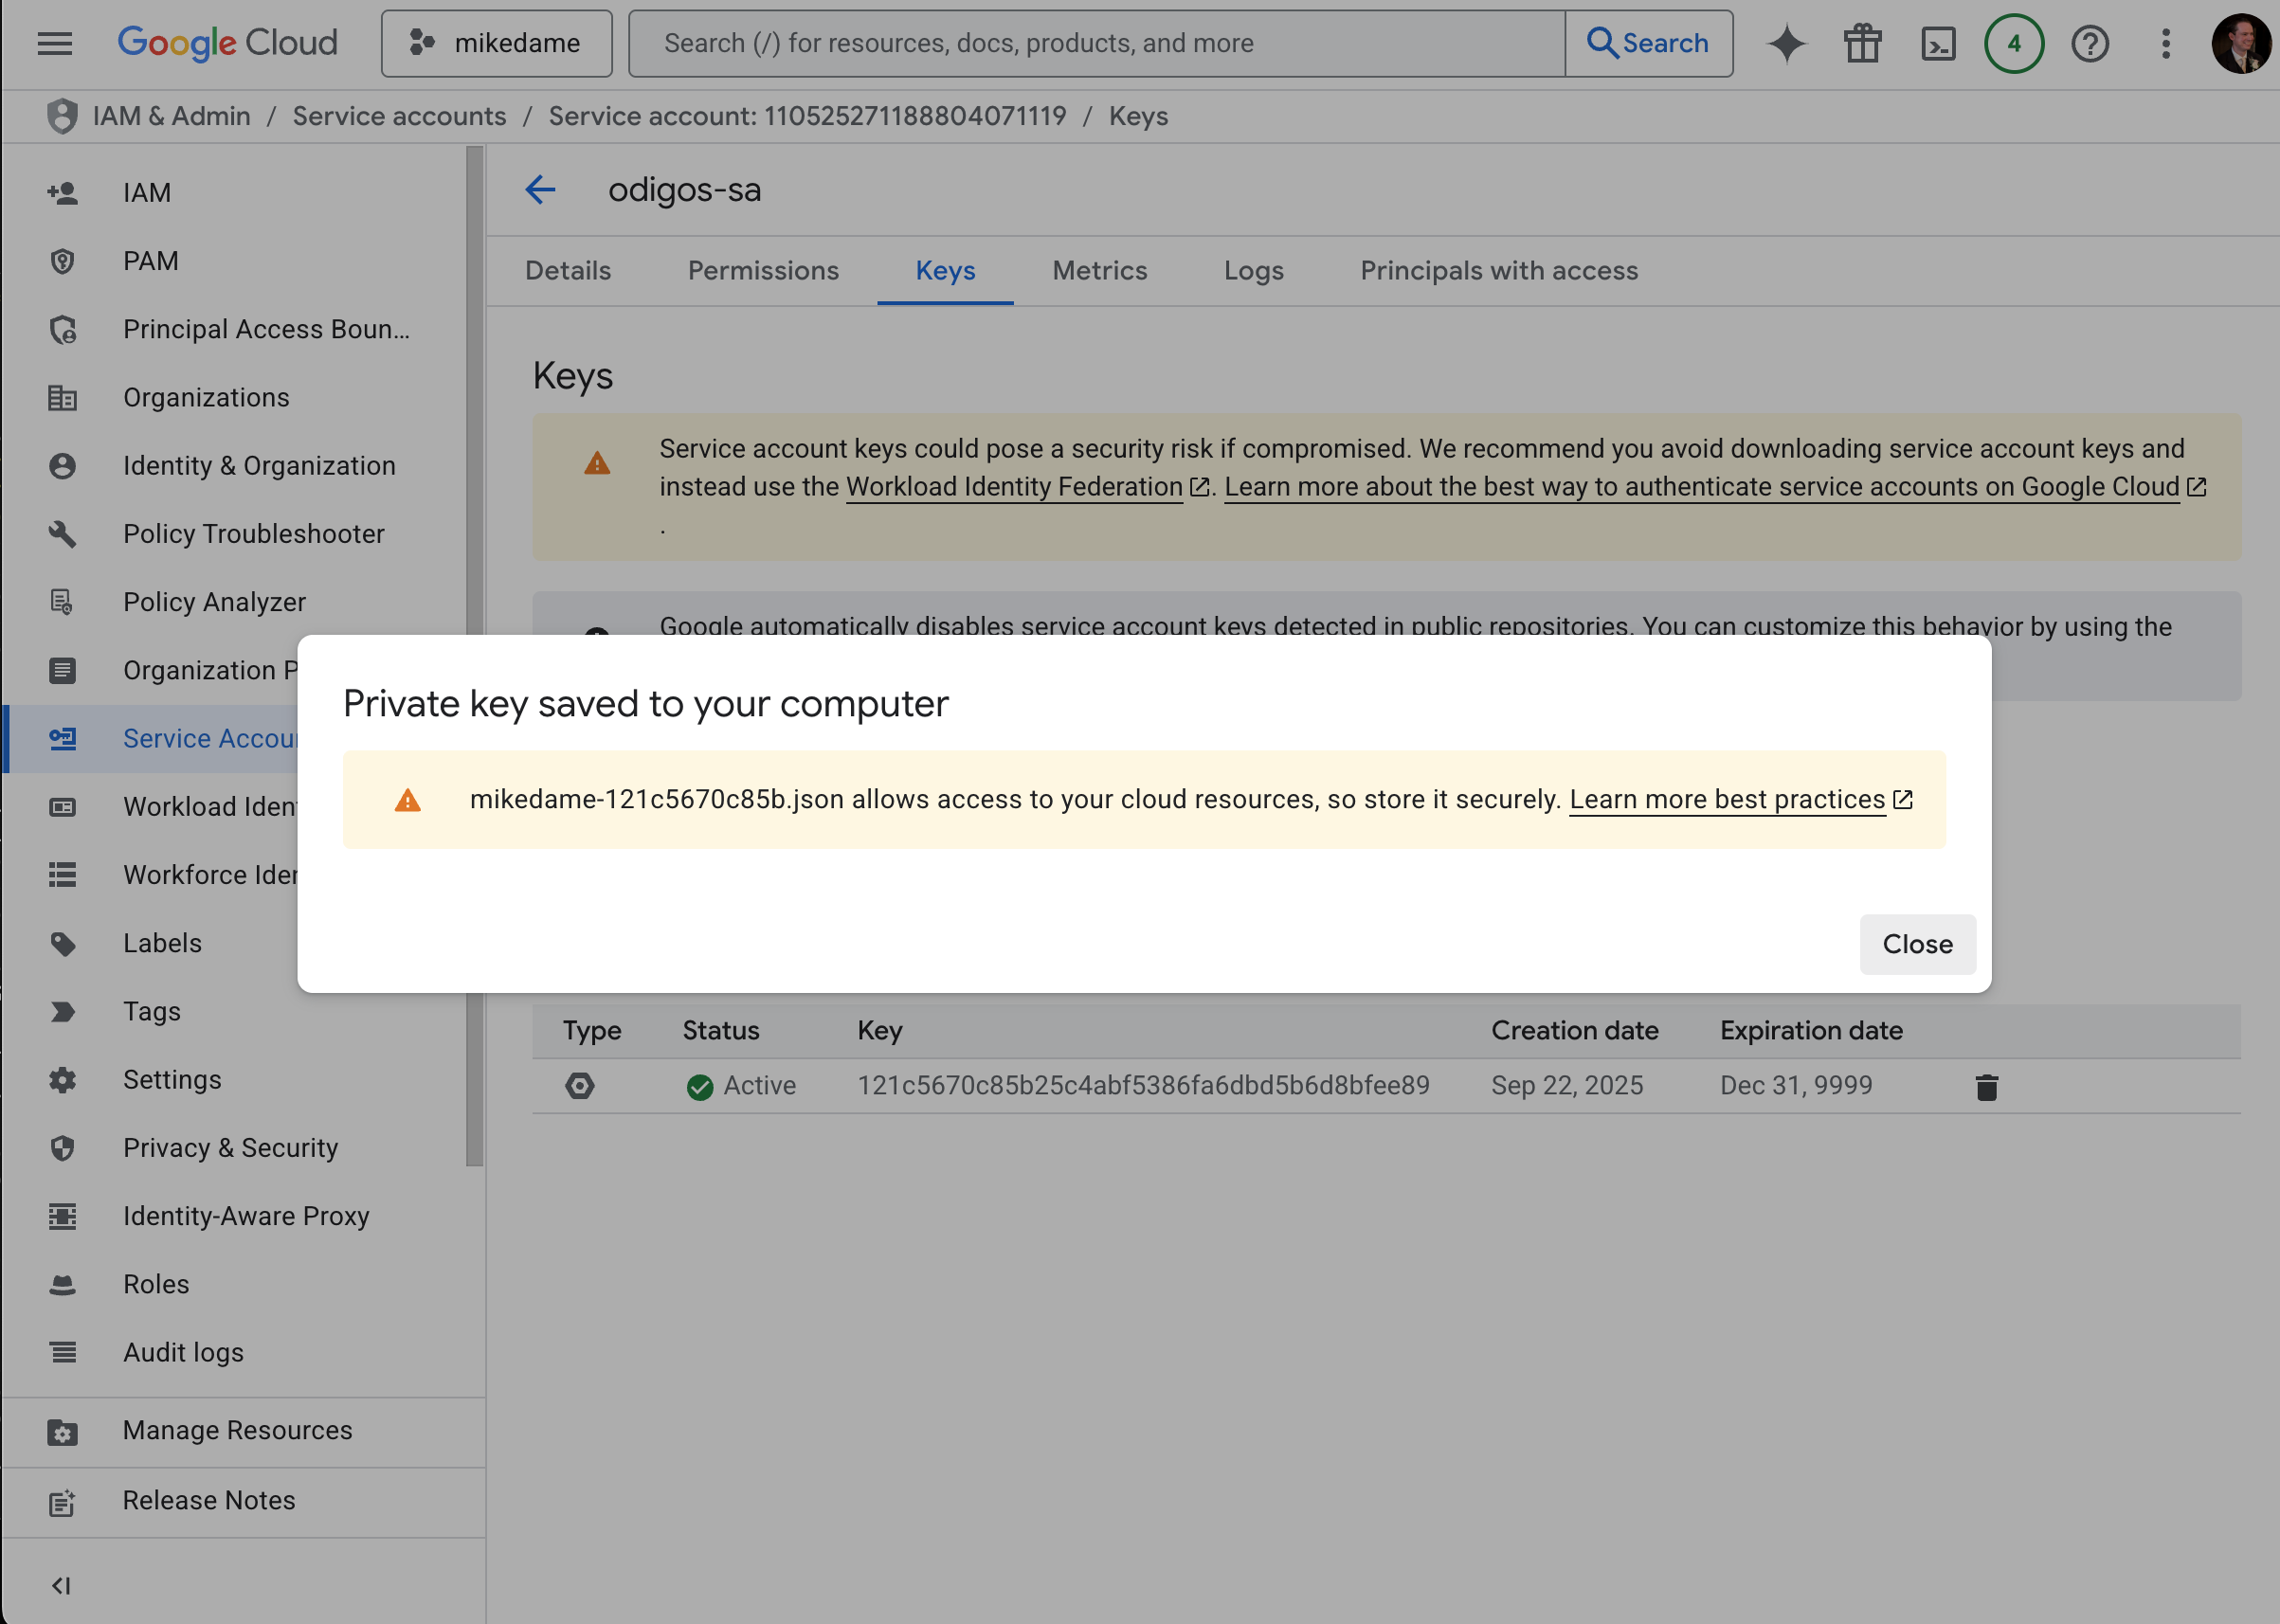
Take note of the saved JSON file on your device. Copy the contents of the file to provide them to Odigos.
In Odigos, find the GCP destination you wish to configure:
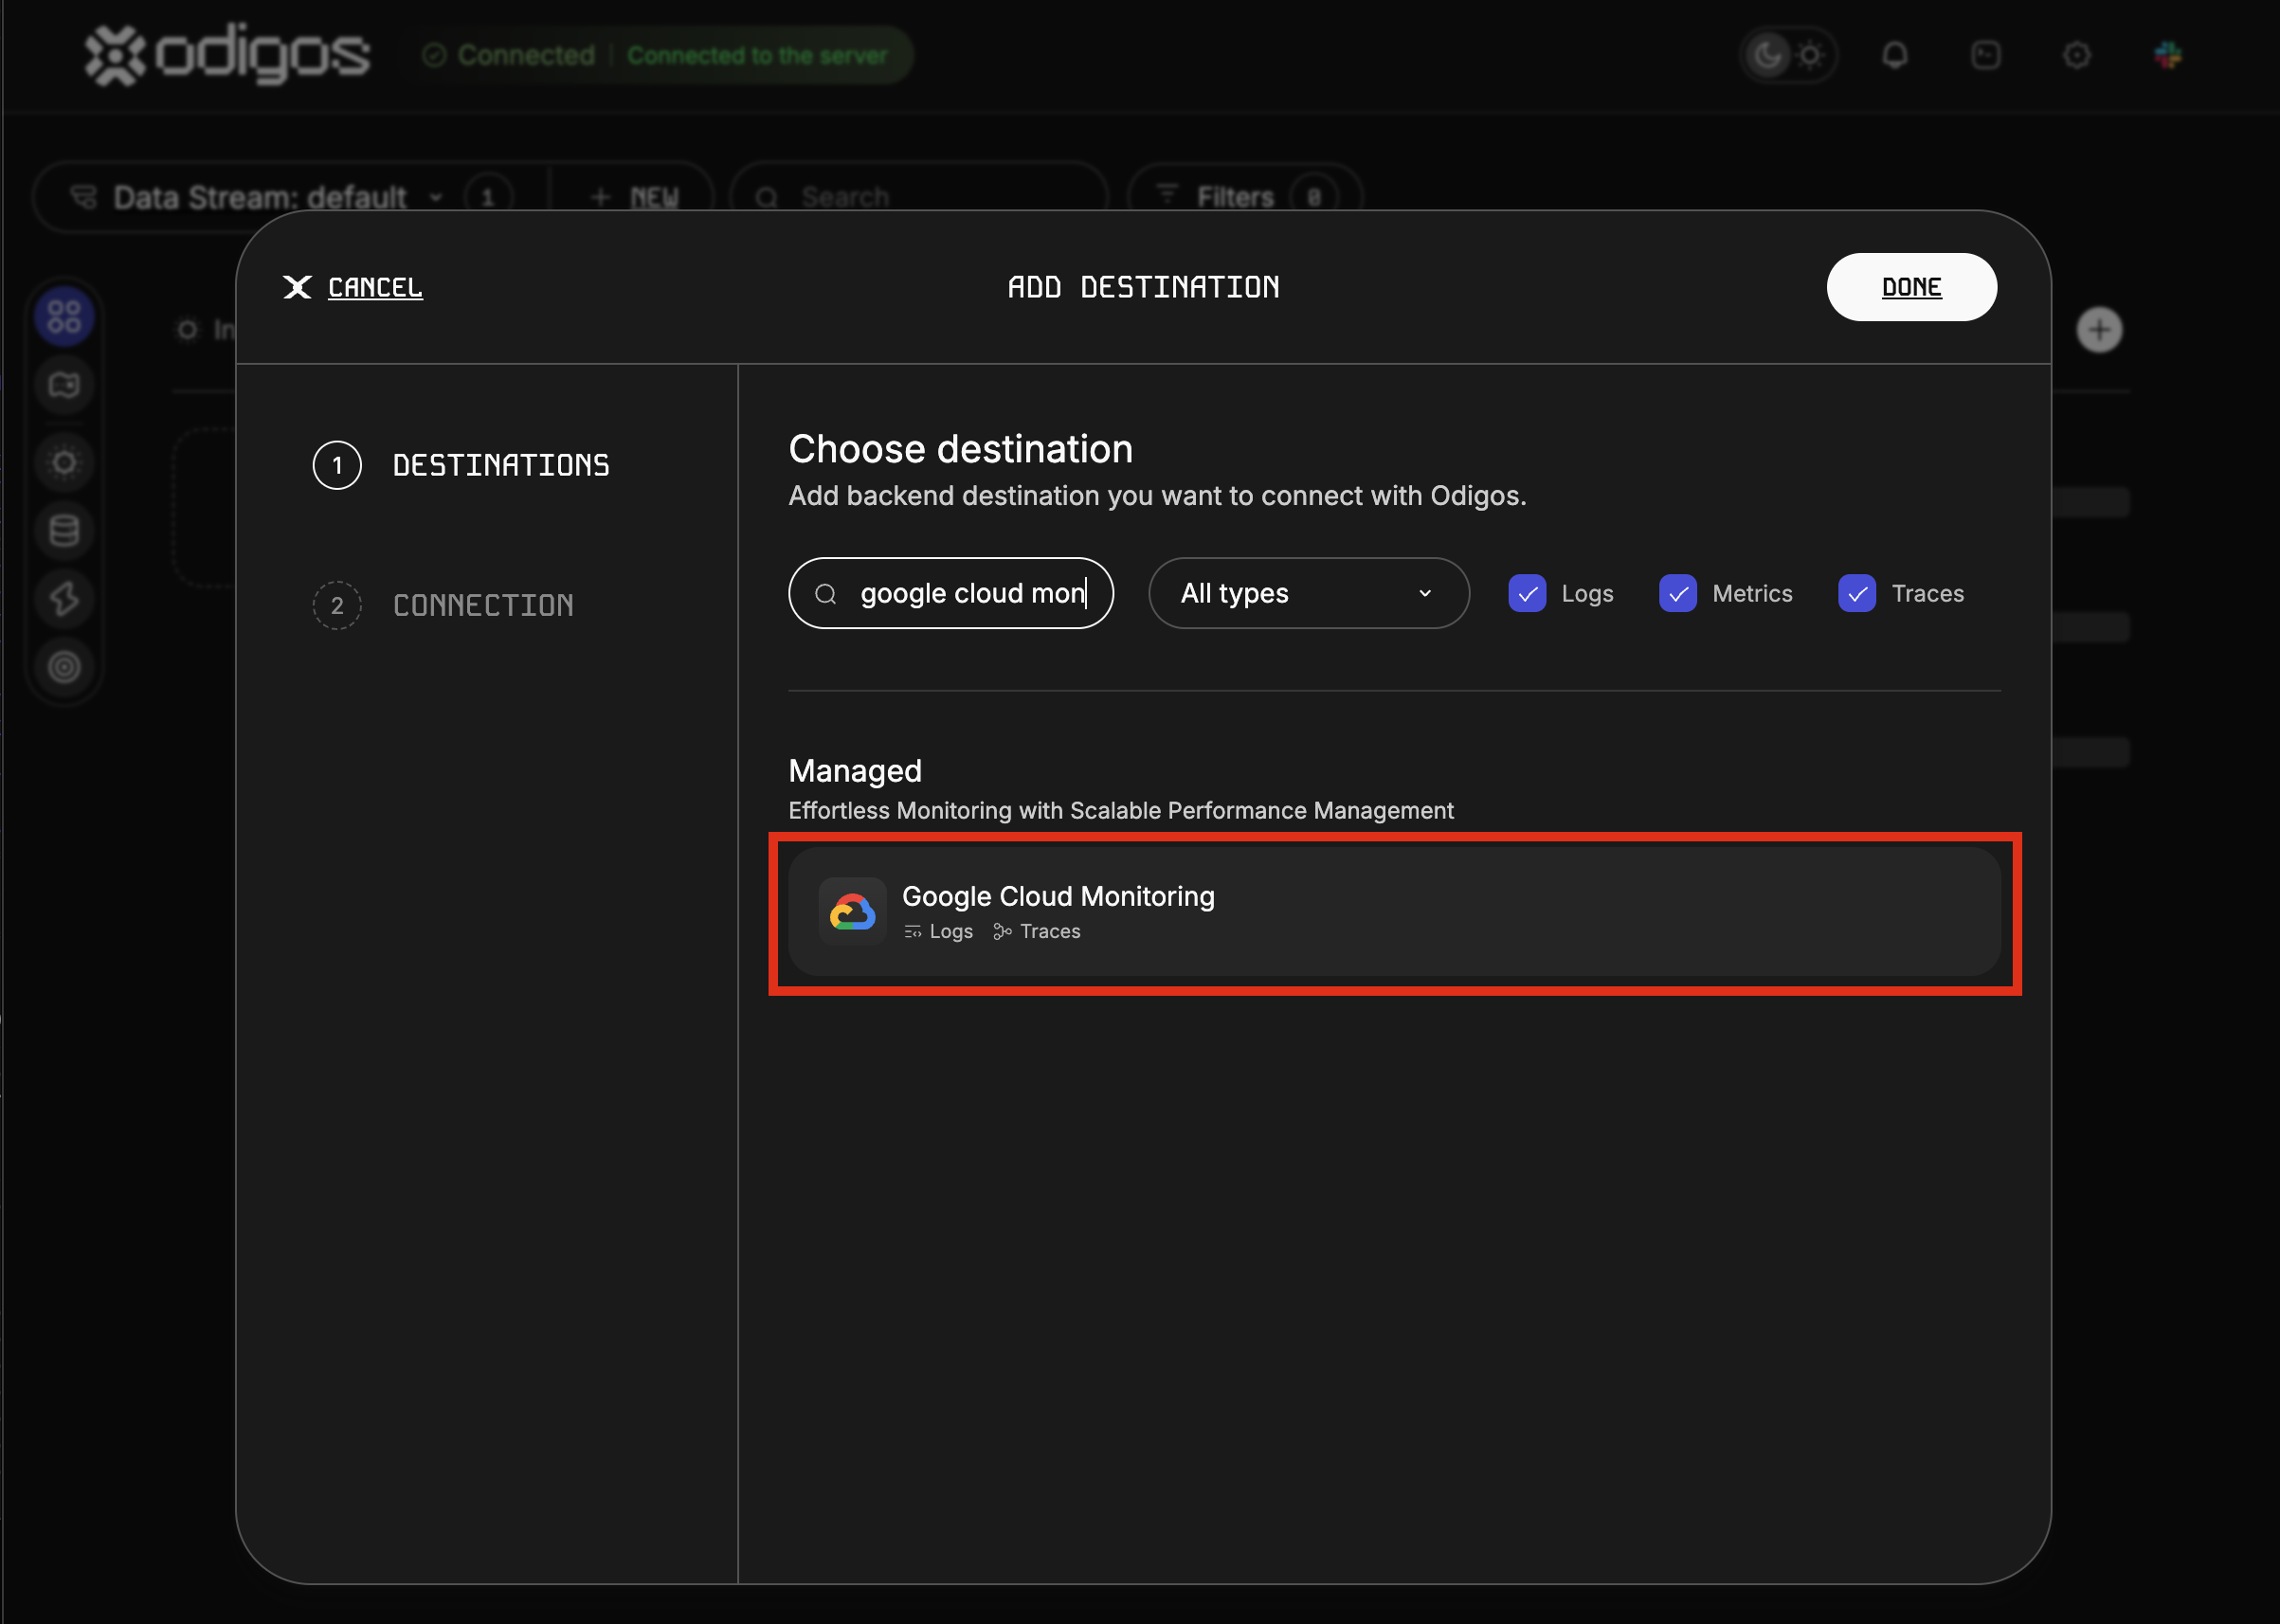
Fill out the Project ID and provide the JSON credentials in the Application Credentials field:
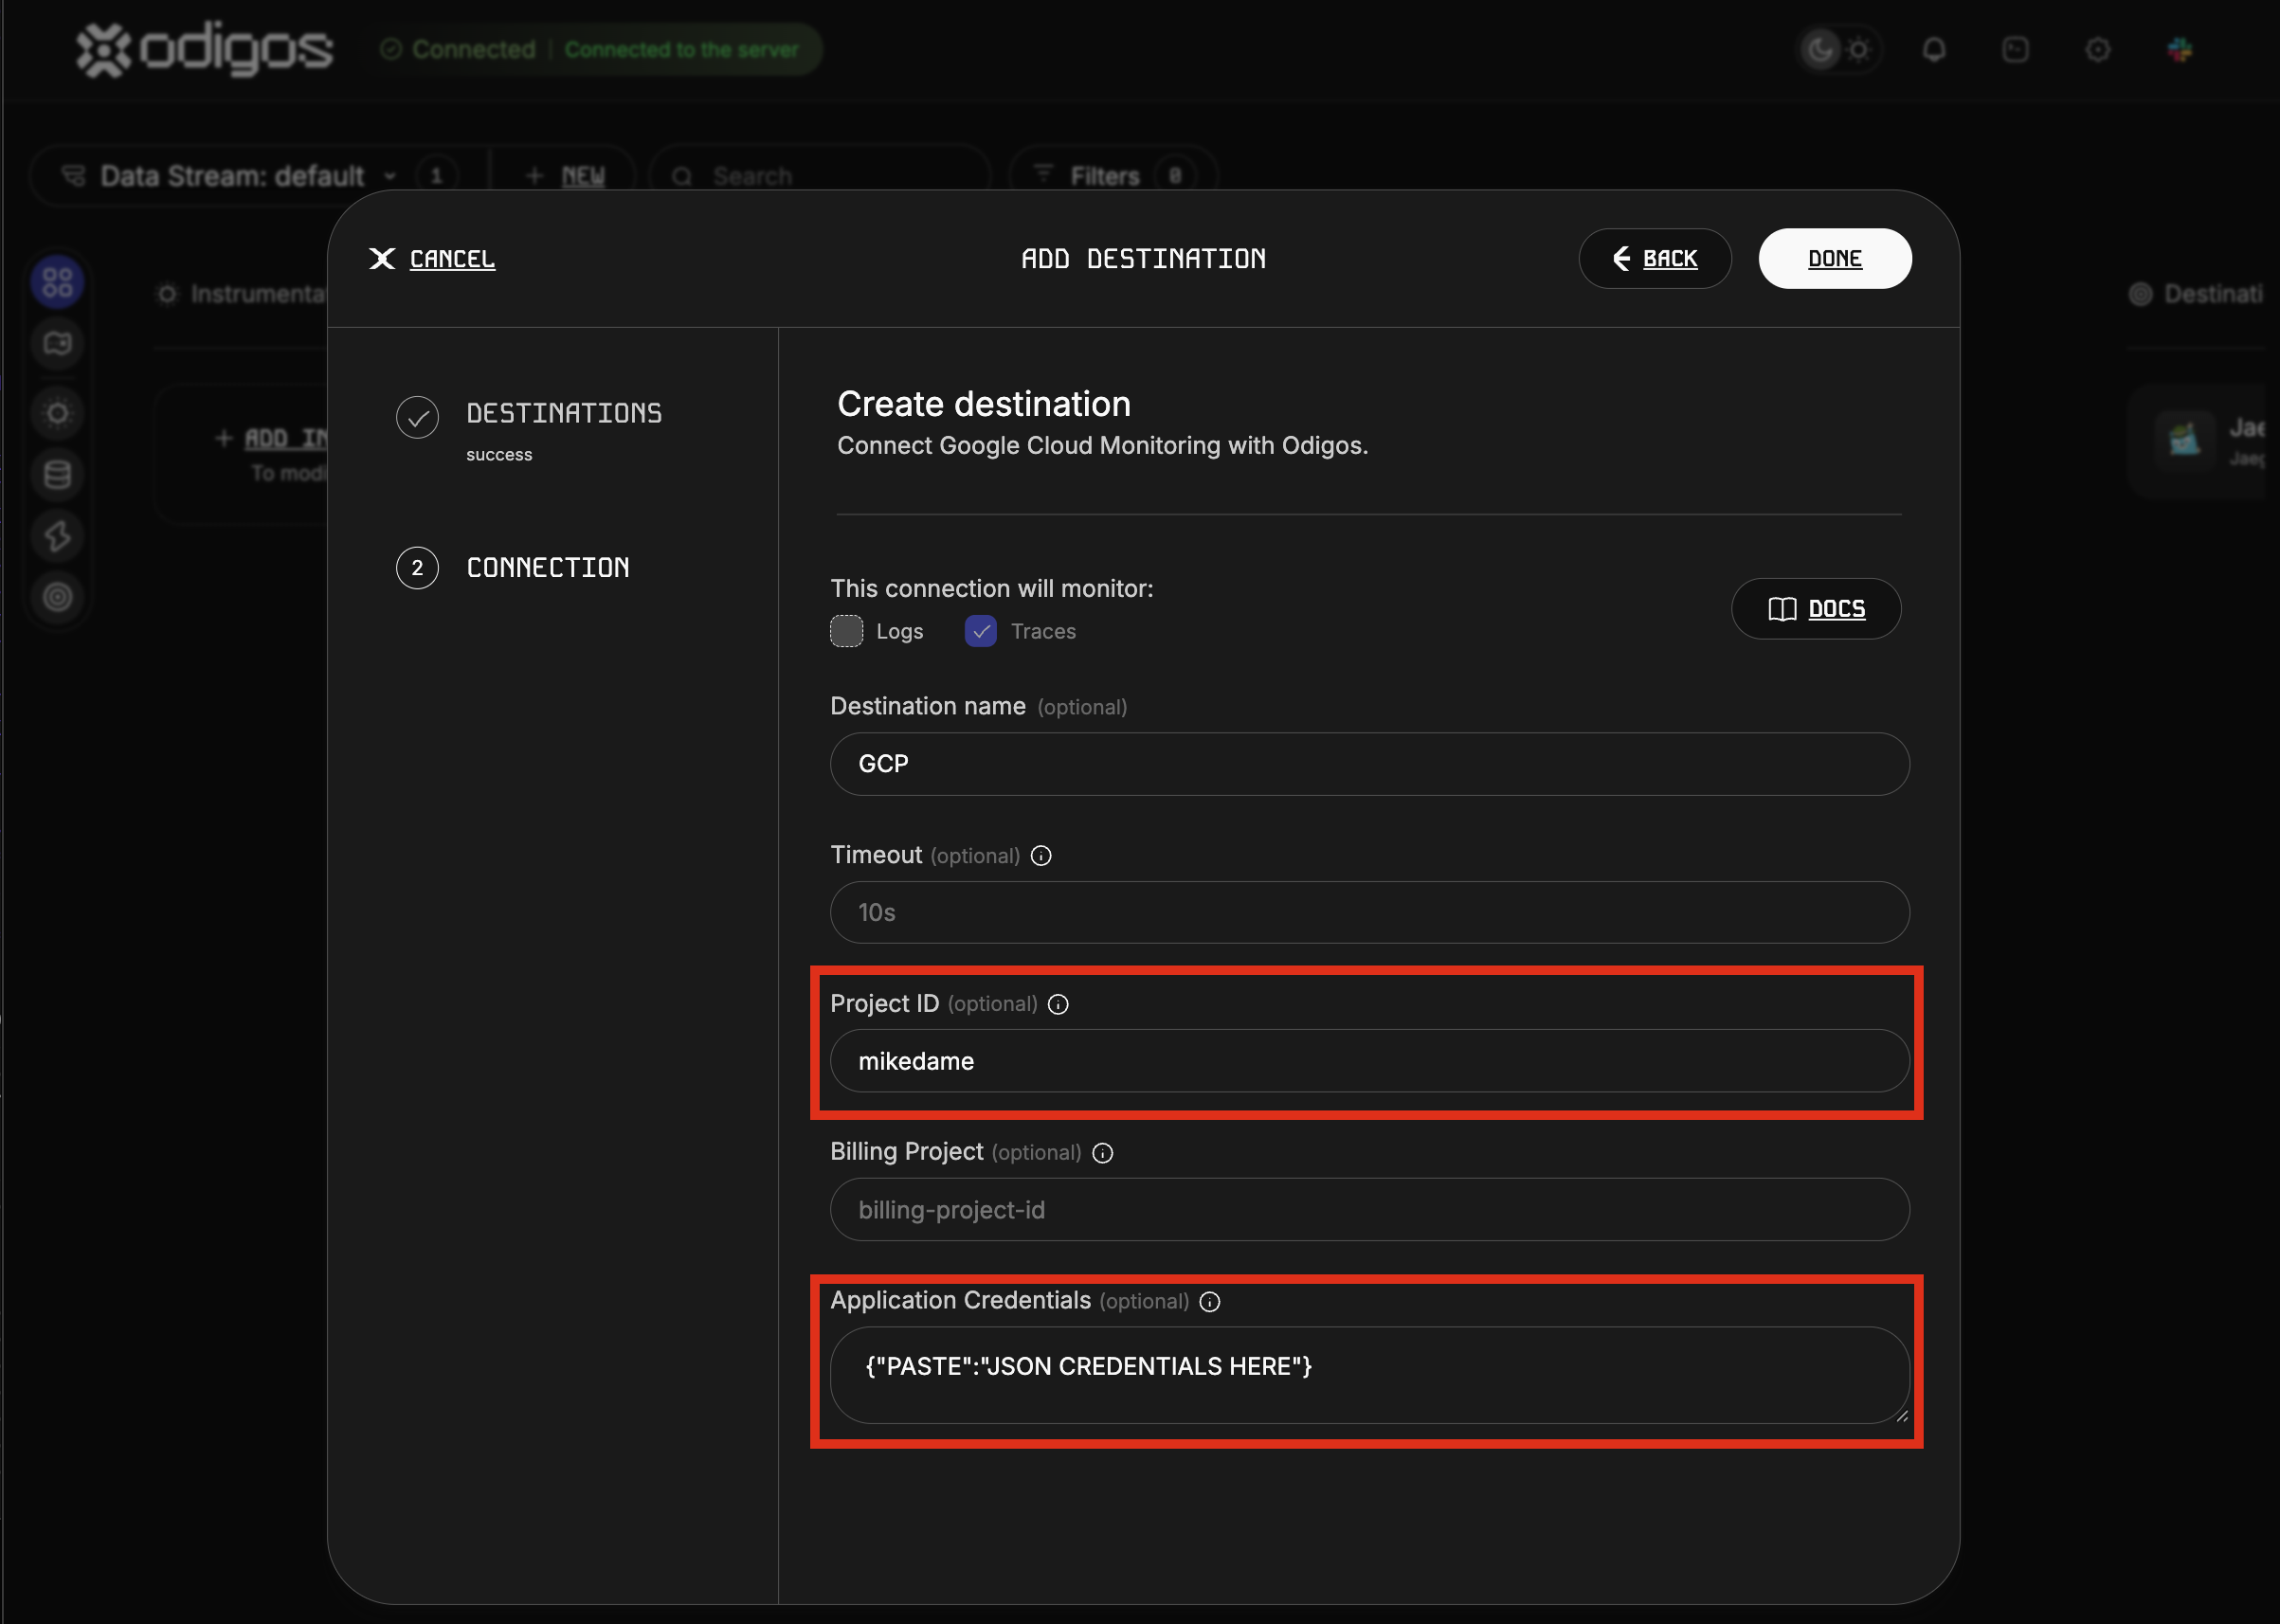
Note that at this point, you can also provide other settings such as Quota Project or Request Timeout.
Click Done and verify that the destination was configured:
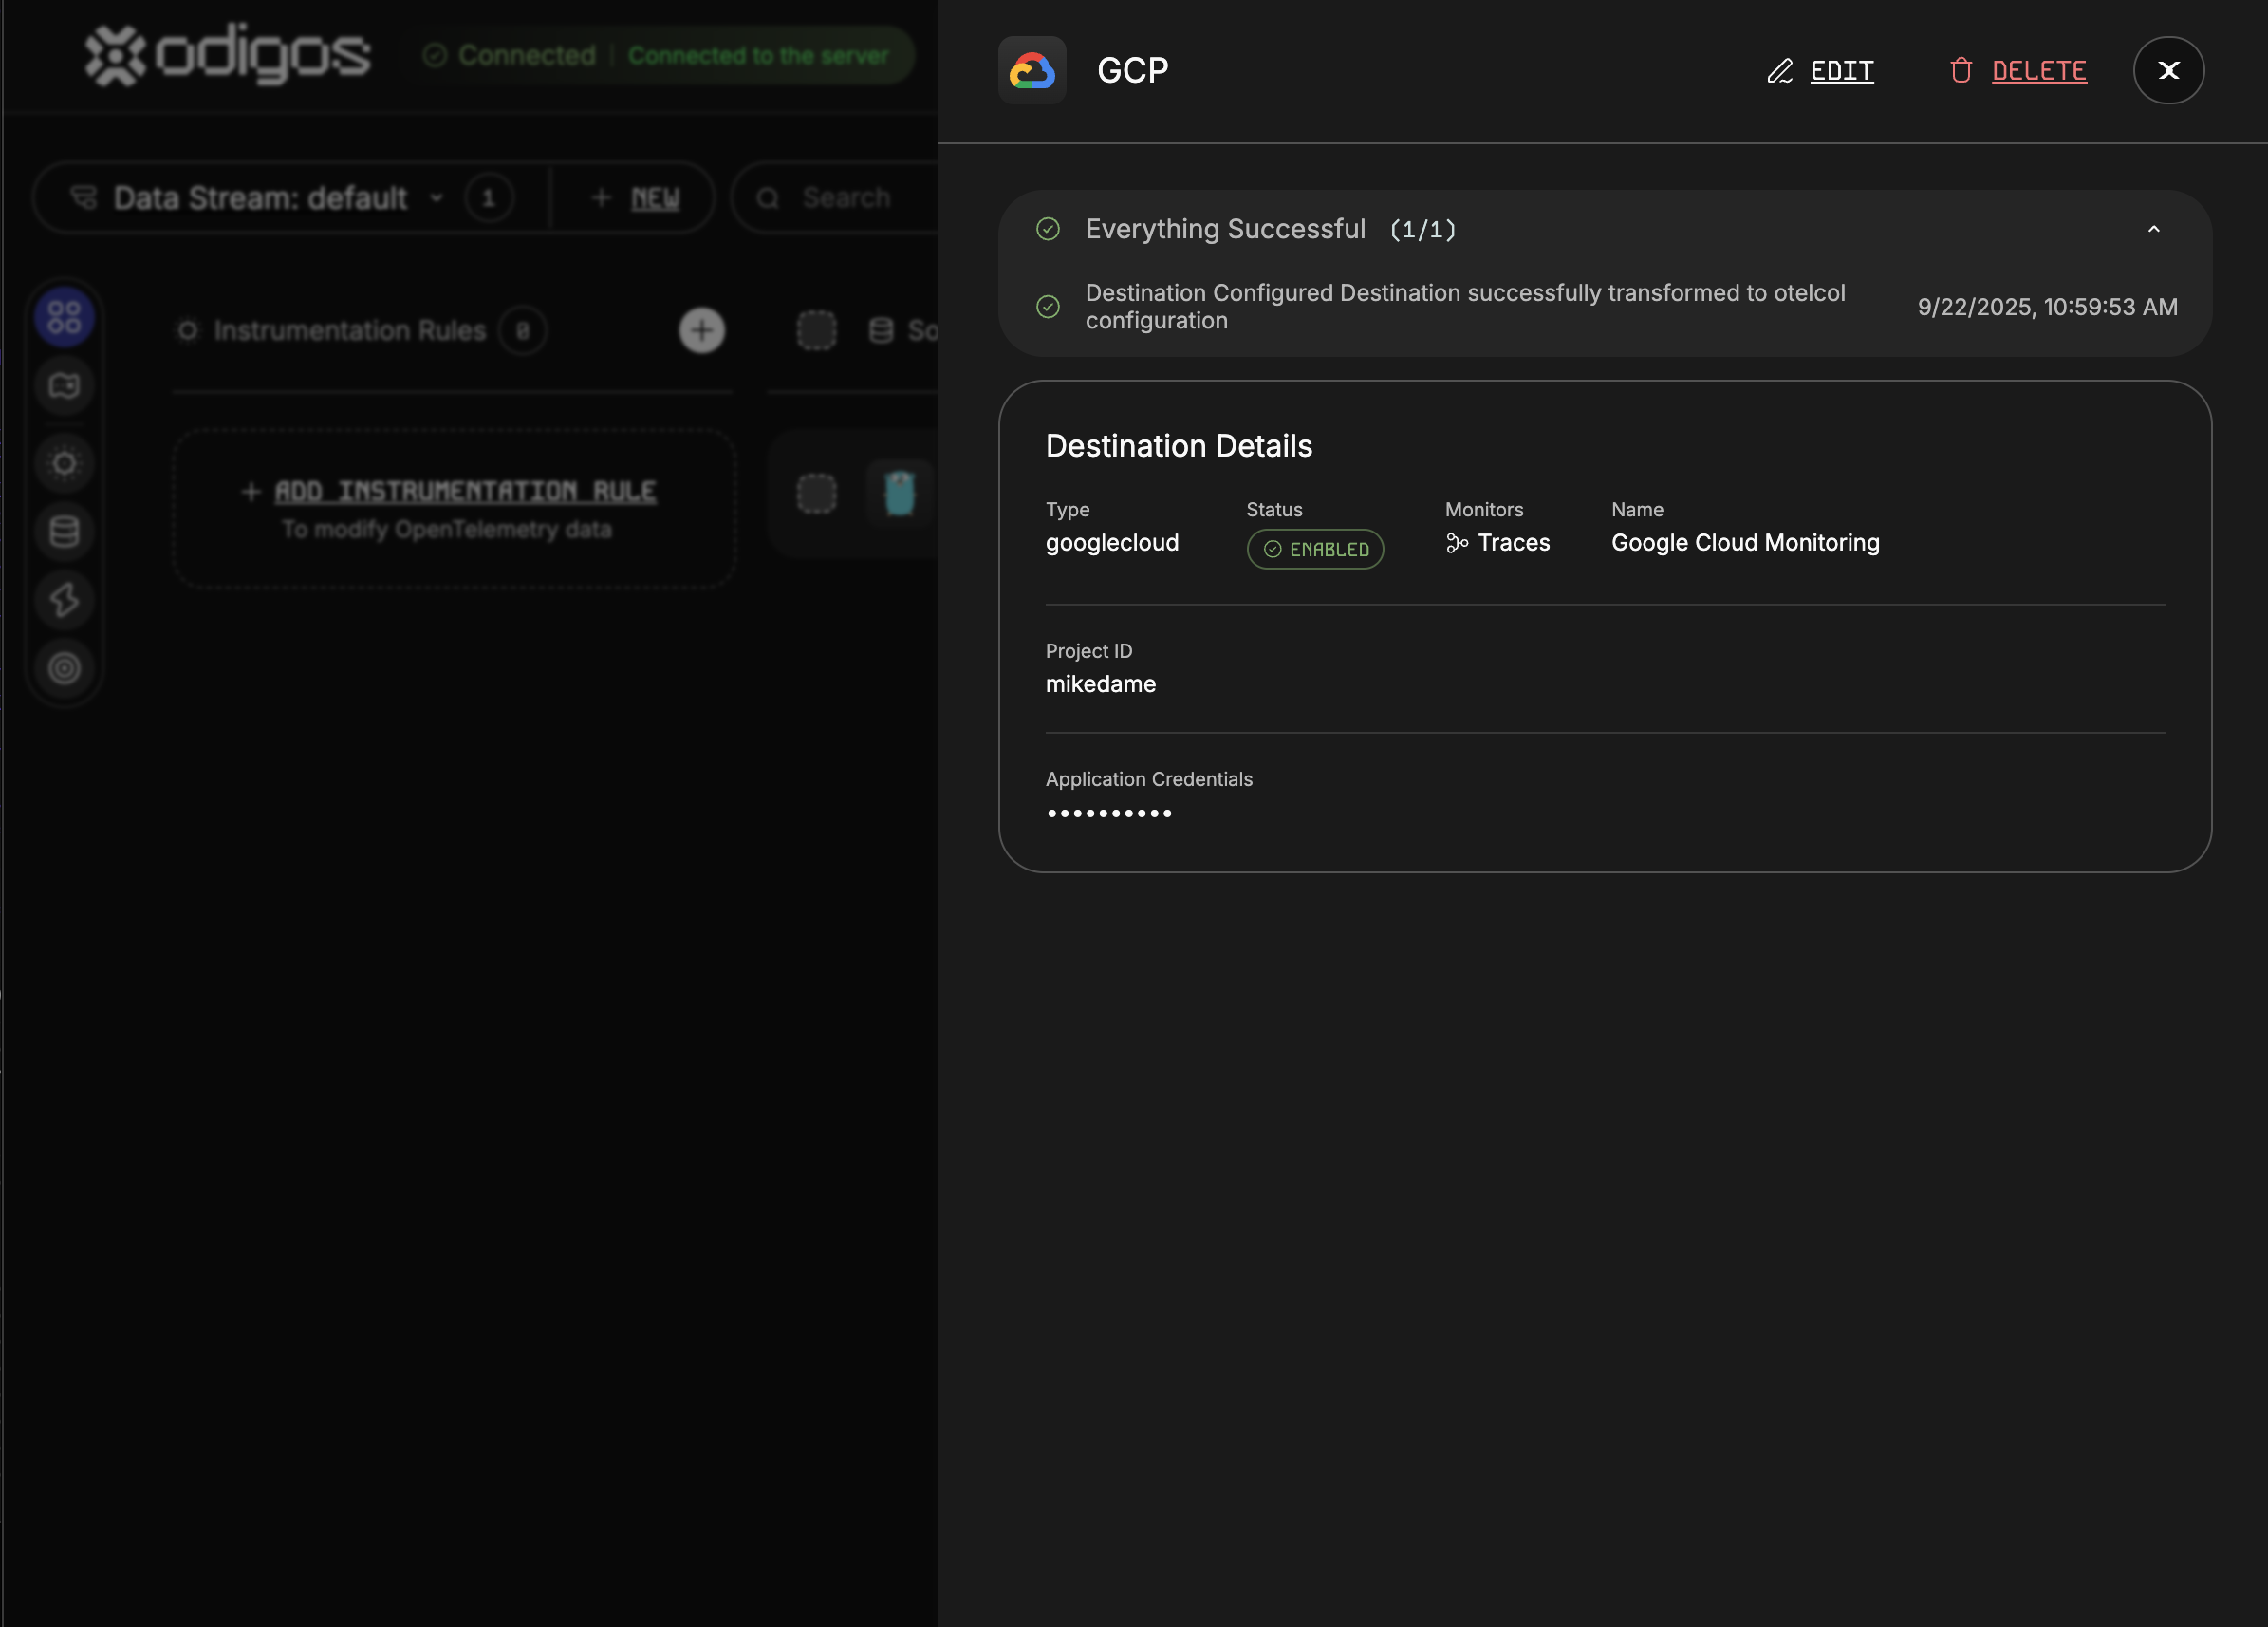
Auto-Instrumentation and Auto-Config with Odigos
Odigos works with all of these standard open source components and abstracts the complexity of configuring them into a simple UI and Kubernetes CRDs.
With Odigos, your entire telemetry pipeline is centralized from instrumentation, to collection and processing, to authenticating and exporting data to your backend. In the case of Google Cloud, this means:
- No importing OpenTelemetry SDKs or vendor-specific Google exporters into your code. All instrumentation is handled automatically, keeping your dependency chain clean and saving developers time.
- Hardened data collection and processing. Odigos deploys Collectors with tested configurations that handle throughput at scale, and lets you to configure additional processing through a single pane.
- Managed Authentication. Where real-world architectures require divergence from the "preferred path", Odigos handles the challenging extra configuration for you.
It's no question that observability backends like Google Cloud build great products for ingesting and analyzing data. Odigos makes it simple to get your data into Google Cloud Observability securely and without extra complexity. On that note, GCP is just one of the dozens of backends currently supported by Odigos, with more always being added and improved.
More from the blog.



Stop guessing. Ask production.
One agent. One service. See how Odigos helps answer a production question.