
Instrumenting C++ Methods with Zero Code Changes
Capturing Custom C++ Methods with Odigos eBPF Instrumentation
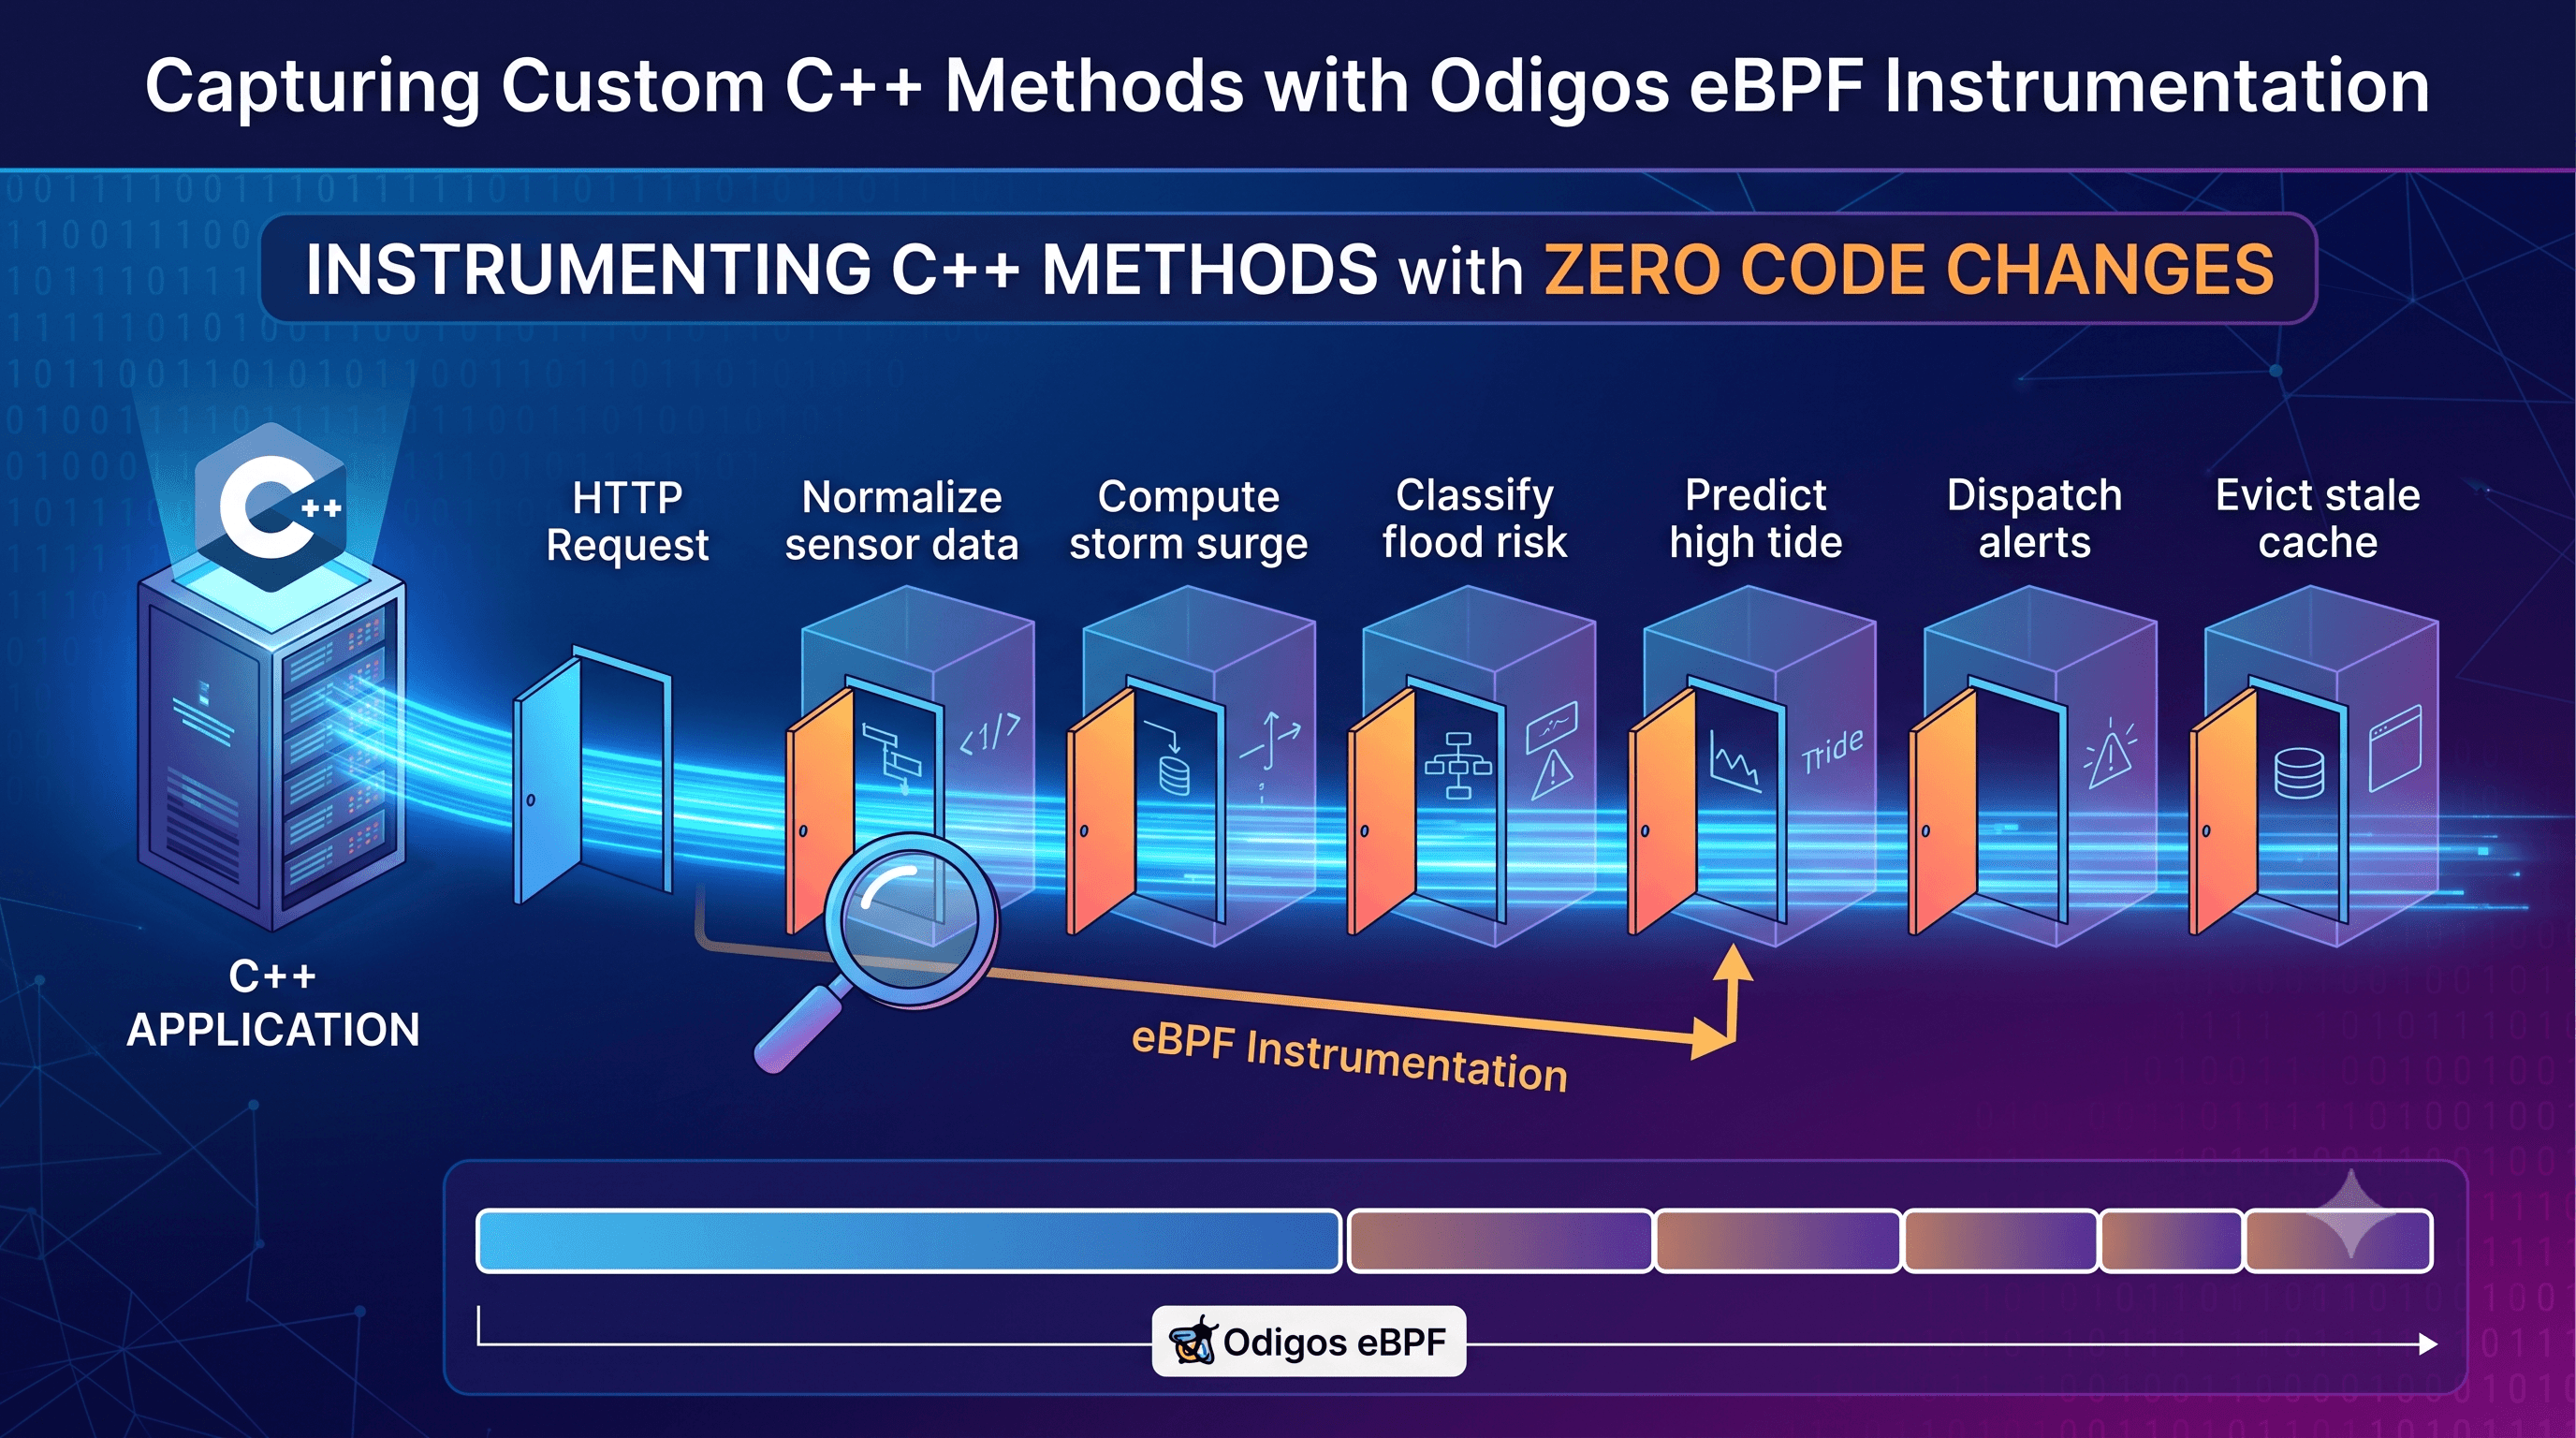
C++ Instrumentation with eBPF: From HTTP Requests to Business Logic Without Restarts
C++ has always been one of the hardest languages to instrument. Unlike Java or Python, there isn't a runtime that exposes application methods for an observability tool to hook into. Every C++ application is compiled into its own native binary, often using different libraries and frameworks. That means there's no single place an observability platform can attach to discover business methods automatically.
In practice, teams have traditionally had to modify source code, rebuild the application, and redeploy it just to trace a handful of functions. That has left platform teams with a difficult choice: settle for vague infrastructure metrics and request-level visibility, or modify the application itself with custom tracing code.
In this post, we'll walk through how Odigos instrumented a running C++ service on a VM. We started with automatic HTTP spans and then used continuous eBPF profiling to discover hot application functions. With one click, we instrumented custom C++ methods without modifying the application, recompiling it, redeploying it, or restarting the running process.
By the end, we went from seeing a single HTTP span per request to a full 9-span trace showing every business-critical C++ method, without changing a line of code or restarting the process.
The C++ observability problem
Observability has become dramatically easier for managed languages over the past decade.
Java applications can be instrumented by modifying bytecode at runtime. Python and Node.js allow instrumentation through runtime hooks and monkey-patching. Go benefits from standardized OpenTelemetry libraries and a growing ecosystem of automatic instrumentation. C++, by comparison, offers far fewer universal interception points once an application has been compiled.
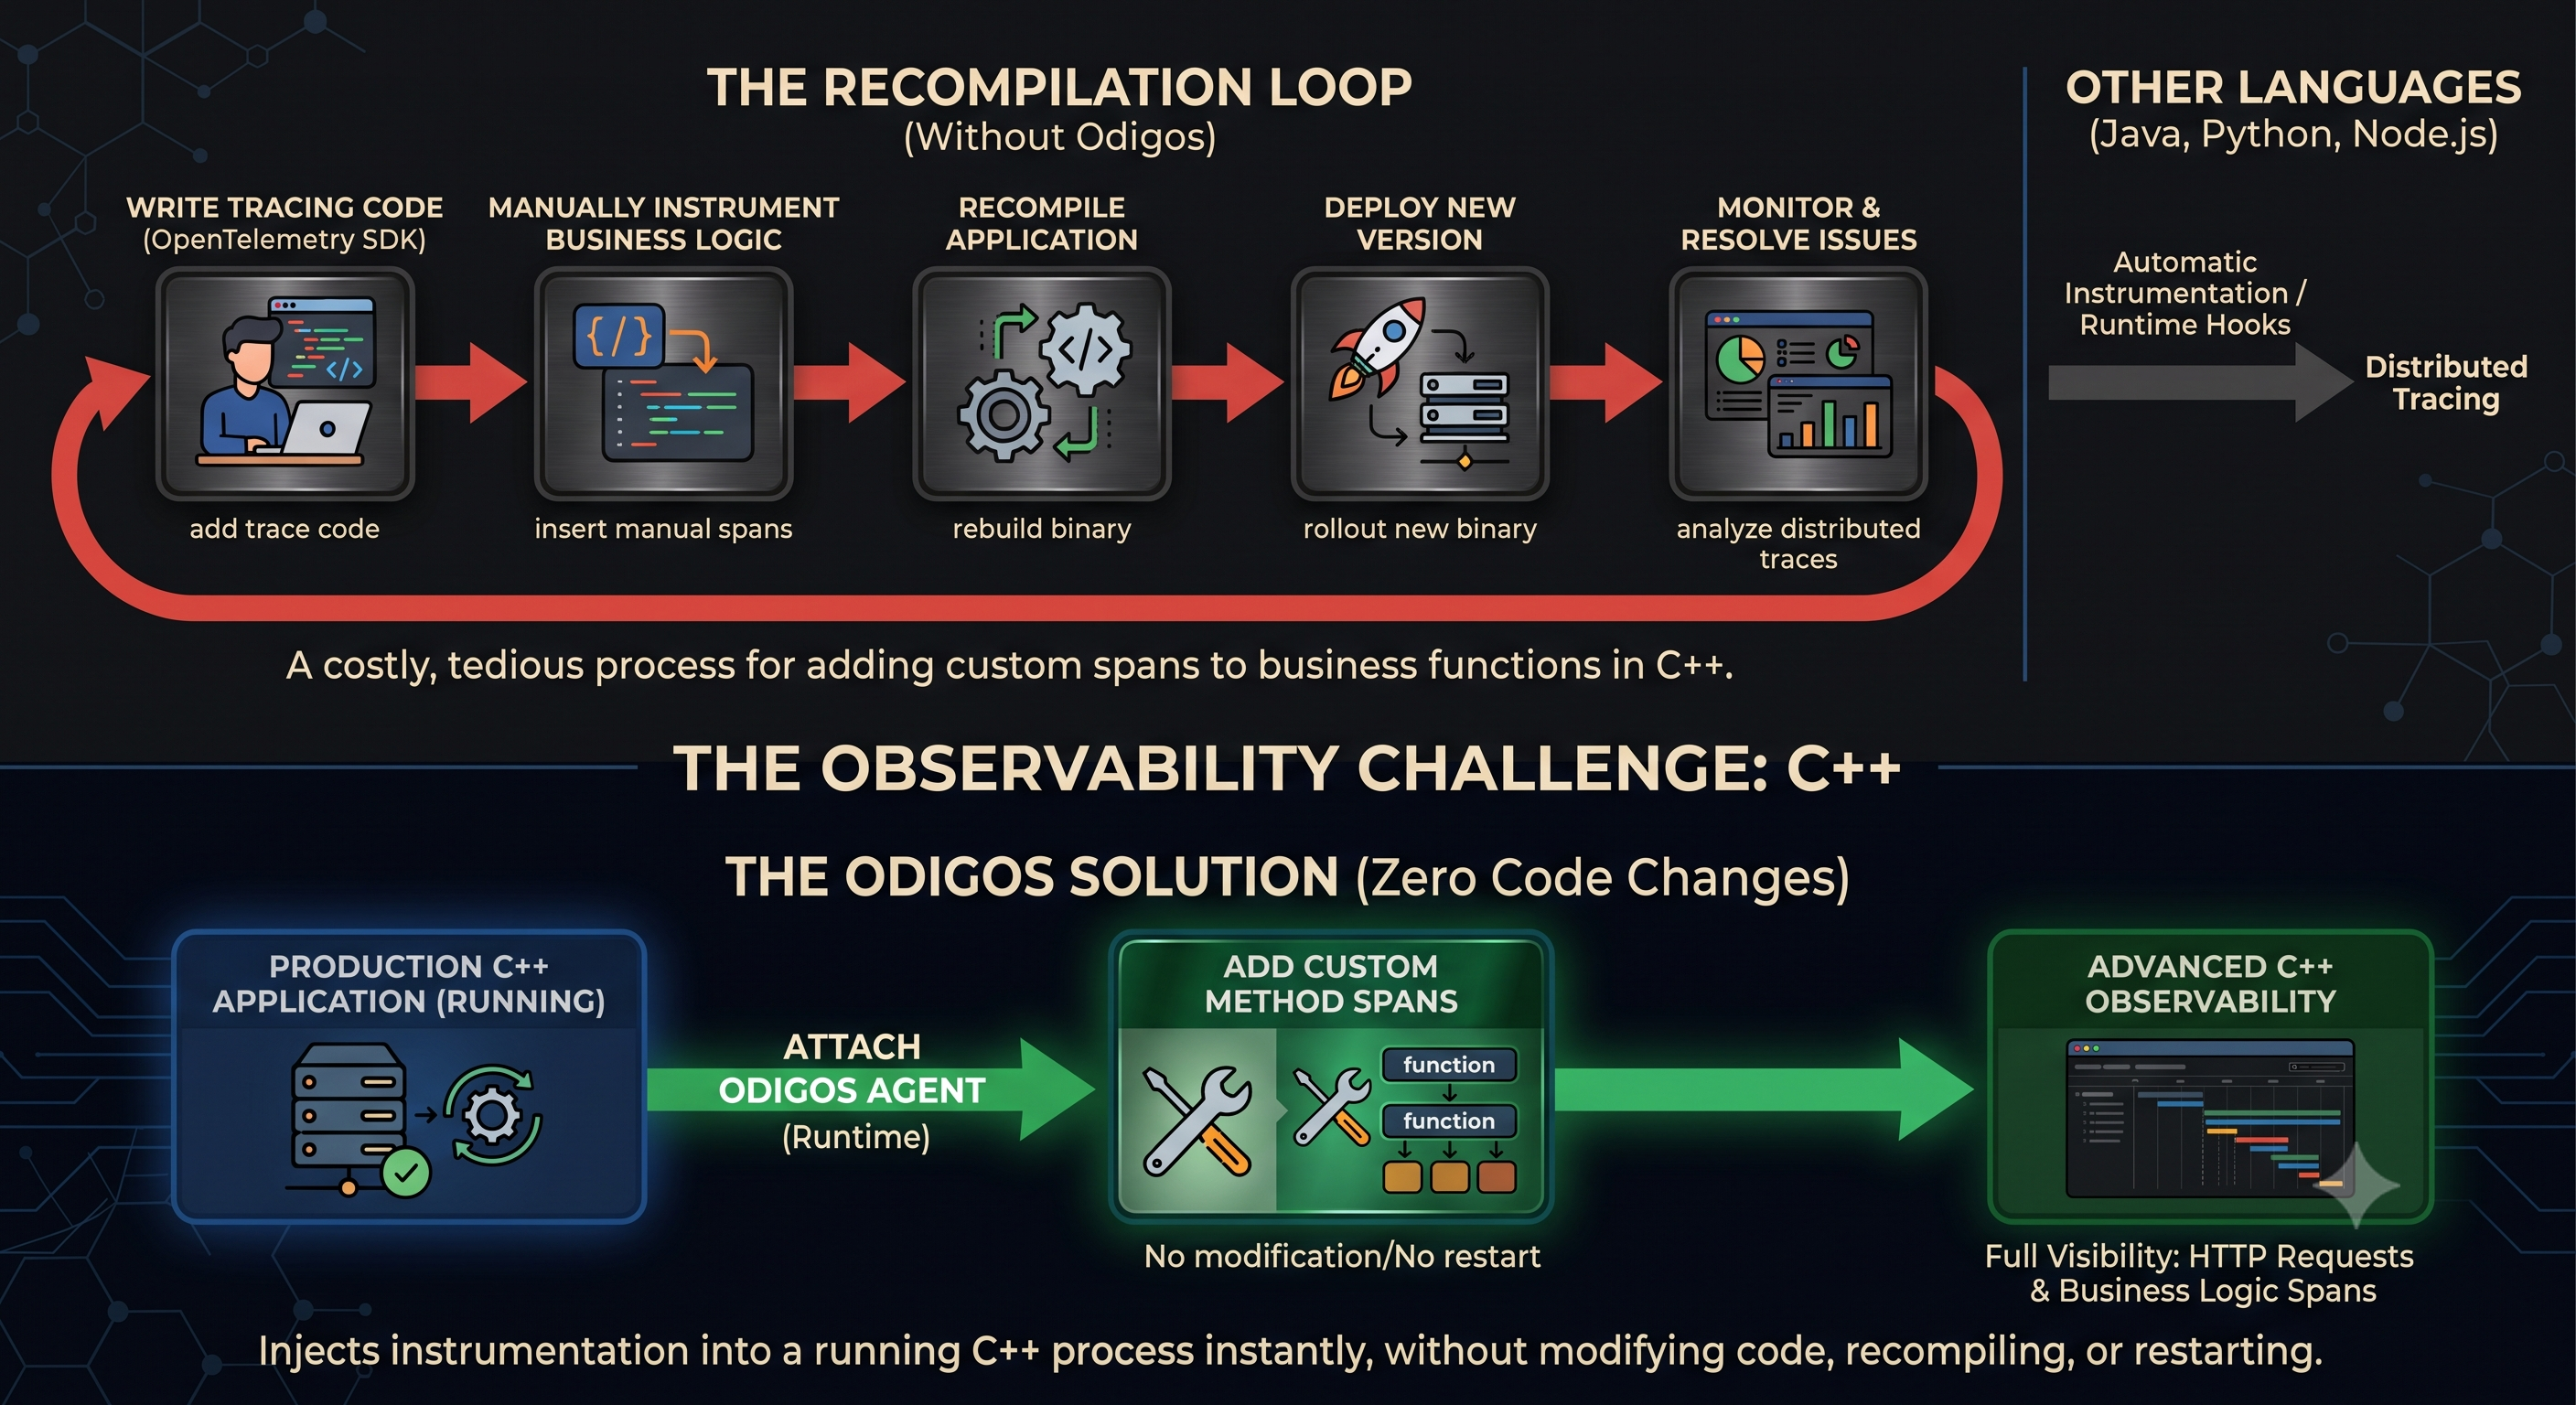
Historically, teams wanting distributed traces from C++ applications had to choose between:
- Adding OpenTelemetry SDKs throughout the codebase
- Manually instrumenting business functions
- Recompiling the application
- Rolling out a new deployment
- Maintaining tracing code alongside application logic
Even profiling can become difficult once production binaries are stripped, making symbol resolution challenging and leaving only raw memory addresses.
Odigos makes it possible to automatically trace HTTP requests in C++ applications without modifying the application. This provides immediate visibility into request latency, throughput, and errors.
But HTTP spans only tell part of the story. The business logic that executes inside a request remains invisible, making it difficult to understand where time is being spent or why a request is slow.
Until Odigos's custom instrumentation capabilities for C++, closing that gap typically meant adding tracing code, rebuilding the application, and deploying a new binary.
In this blog, I will show how Odigos adds custom C++ method spans to a running process without code changes or restarts.
The demo application: Tidegate
To demonstrate this, I built Tidegate, a fictional coastal flood-risk monitoring service written in modern C++17.
Internally, Tidegate simulates several realistic workloads:
- NOAA tide-gauge sensor ingestion
- Hydrological storm surge modeling
- Flood zone classification
- Tidal prediction
- Alert dispatch
- Cache eviction
The service continuously generates background traffic, while a special endpoint:
GET /api/v1/coastal/full-assessment
executes every major subsystem in a single request.
Rather than showing the source code, it's easier to think of the application like this:
HTTP Request
      │
      ▼
 Tidegate API
      │
      ▼
 Processing Pipeline
 ├─ Normalize sensor data
 ├─ Compute storm surge
 ├─ Classify flood risk
 ├─ Predict high tide
 ├─ Dispatch alerts
 └─ Evict stale cache
What we saw out of the box
Before adding any custom instrumentation, Odigos already provided immediate value.
Odigos automatically discovered the application's HTTP traffic and generated request-level spans such as:
GET /api/v1/hydrology/surgeGET /api/v1/alerts/dispatchGET /api/v1/coastal/full-assessment
These spans came from eBPF network-layer HTTP instrumentation, not from understanding the C++ application itself.
Each trace initially contained just a single HTTP request span.
That alone is useful.
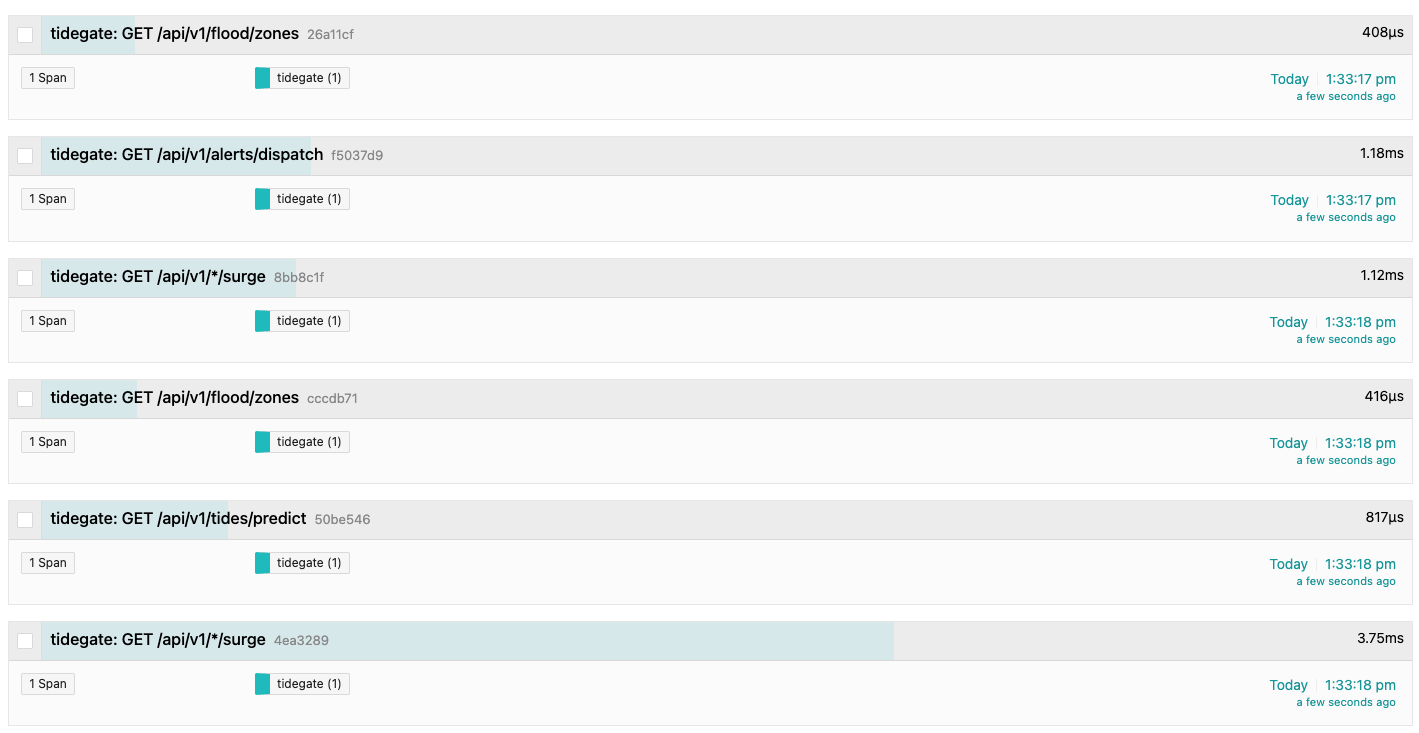
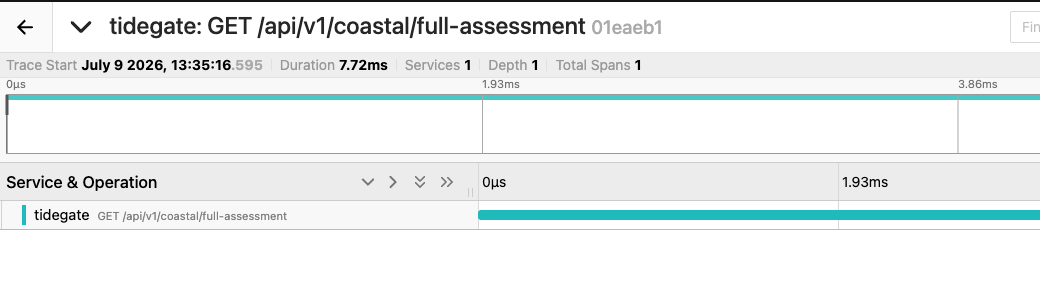
You immediately gain request tracing, latency measurements, throughput, and error visibility.
But if an endpoint suddenly slows from 10 ms to 500 ms, you still don't know why.
Was the hydrology engine slow?
Was cache eviction blocking?
Did flood classification become expensive?
The business logic remained a black box.
The Solution: Profile the Process and add Custom Signatures
The entire workflow took place against a running process on EC2.
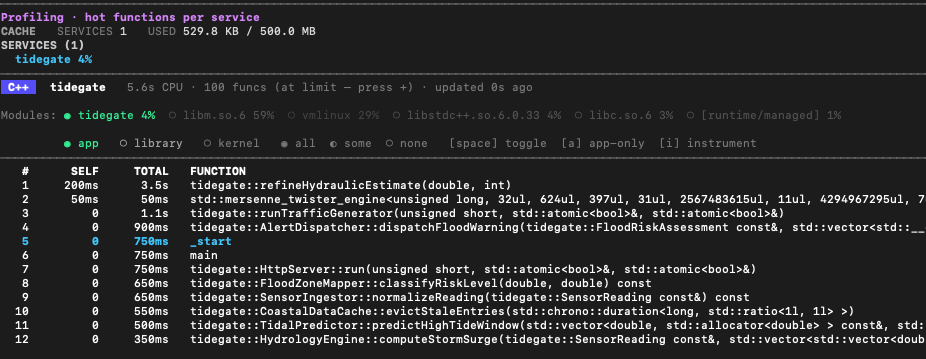
Step 1: Open the continuous CPU profiler in Odigos
Inside odictl, we opened the continuous profiler and saw live methods in use.
I filtered the profile to focus on application code rather than kernel and libc functions.
Step 2: Instrument custom C++ signatures
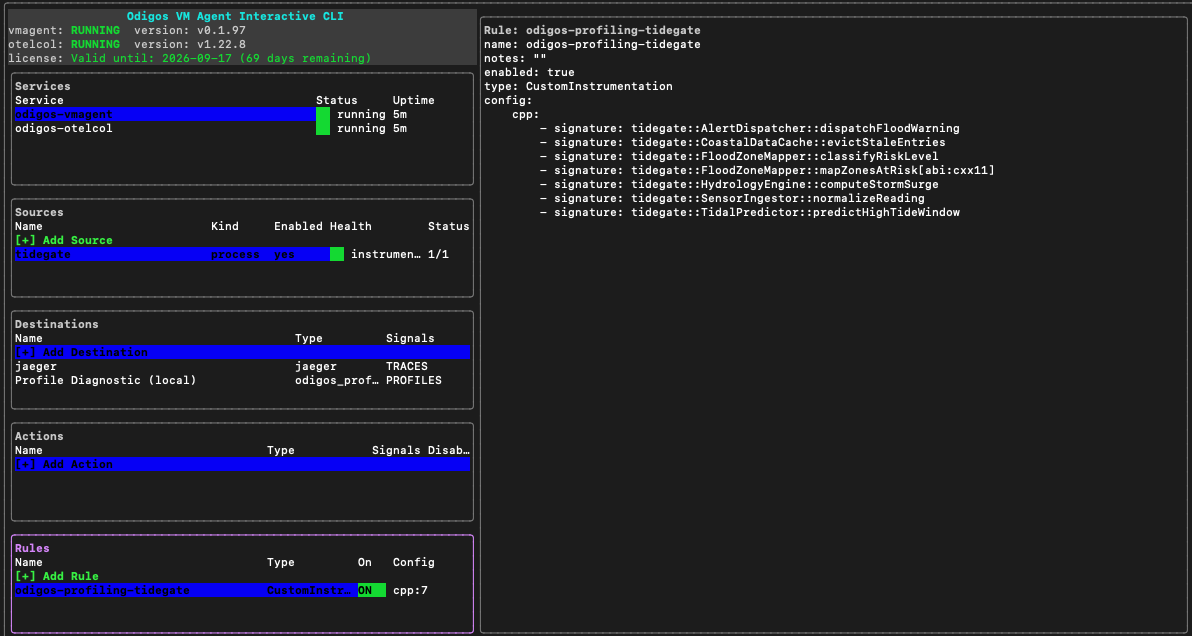
From the profiler, pressing i on a hot function created a custom instrumentation rule.
Odigos uses the C++ signature format:
namespace::Class::method
The same signatures can also be defined manually in configuration:
config:
  cpp:
    - signature: tidegate::HydrologyEngine::computeStormSurge
This provides a useful fallback when profiling only exposes offsets or when you already know the symbol names you want to instrument.
Most importantly, these instrumentation rules were applied to the running process.
There was no restart.
The process continued serving traffic while new spans began appearing.
I repeated this workflow until all six business methods had been instrumented.
Step 3: Verify in Jaeger
Finally, we opened Jaeger and filtered for:
GET /api/v1/coastal/full-assessment
Instead of a single HTTP span, we now see the complete execution flow.
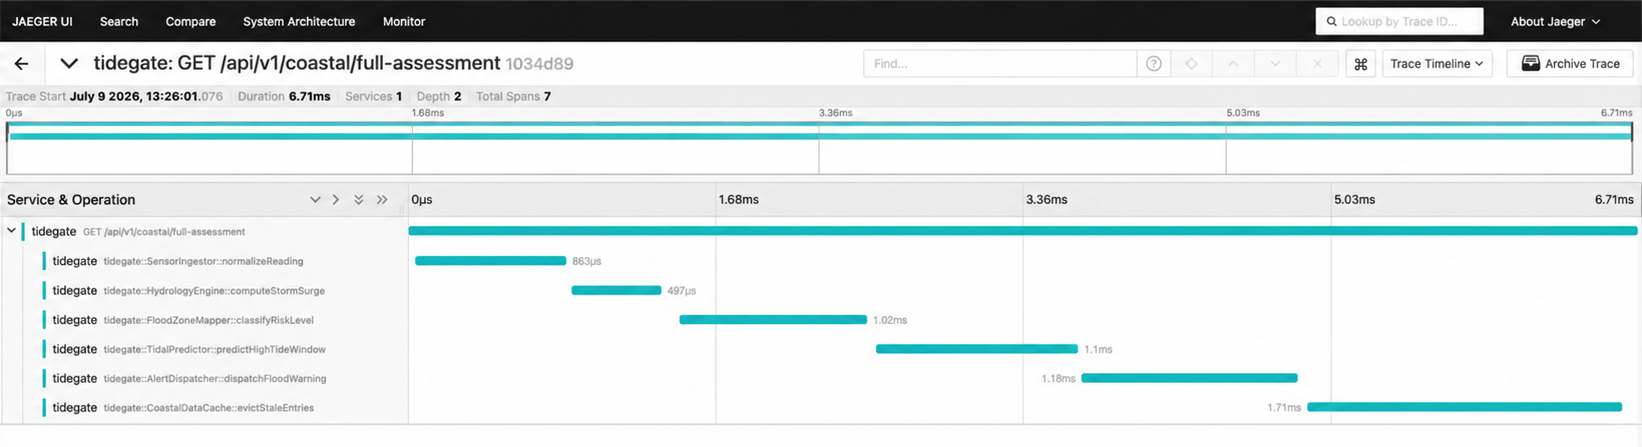
The trace contained:
- 7 spans
- Approximately 7 ms total duration
- 6 Child Spans
All six custom C++ method spans appeared as siblings beneath the processing span, preserving call order while sharing the same trace ID and parent request.
The result was a complete end-to-end trace from HTTP request to business logic execution.
Why this is game-changing
No code changes
The application itself remained untouched.
No SDKs, macros, tracing APIs, or instrumentation libraries were added.
No recompilation or redeployment
Everything happened against an already-running production process on a VM.
No restart
Perhaps most importantly, custom instrumentation rules became active without restarting the application.
Profile-driven discovery
Rather than guessing mangled symbols or searching through binaries, the profiler provides a visual starting point for discovering where execution time is actually spent.
No need to involve developers.
Business-logic visibility
Automatic HTTP tracing gets you to the front door.
Custom C++ signatures let you see what happens once the request enters your application.
eBPF-based instrumentation
Because the workflow builds on eBPF, it works well for native compiled applications where traditional language agents have historically struggled.
Before vs. after
| Before | After |
|---|---|
| 1 span per trace (HTTP only) | 9 spans per trace (HTTP + lifecycle + 6 methods) |
| No visibility into C++ methods | Full call chain with demangled method signatures where available |
| Manual symbol hunting | Profile → press i → done (or add a cpp.signature rule manually) |
Bringing modern observability to native applications
For years, deep tracing in C++ meant modifying the application, rebuilding it, and carefully maintaining instrumentation alongside production code.
That model doesn't scale well for large native applications.
By combining automatic HTTP instrumentation with continuous eBPF profiling and live custom C++ instrumentation, Odigos makes it possible to start with request-level visibility and progressively drill down into the business logic that matters most.
The workflow is simple:
- Discover your running process.
- Profile it continuously.
- Identify hot functions.
- Instrument the business methods you care about.
- Watch them appear in your traces without restarting the application.
If you're running C++ workloads on virtual machines, try the Odigos VM Agent, explore your services with the built-in profiler, and turn your most important business methods into spans.. all without touching your source code!
More from the blog.



Stop guessing. Ask production.
One agent. One service. See how Odigos helps answer a production question.