odigos
open-source
jaeger
opentelemetry
Combining Odigos and Jaeger for instant distributed tracing
This article explains how to simplify distributed tracing using Odigos and Jaeger for improved observability in microservices-based applications.

 Eden Federman
Adopting distributed tracing is a great way to improve the observability of your microservices-based applications. However, it can be a challenging task to implement distributed tracing in a production environment. In this blog post, we will show how to combine Odigos and Jaeger to make distributed tracing easy.
Target application
We will use an application called emojivoto. It is a simple web application that allows users to vote for their favorite emoji. The application is written in Go and uses gRPC for communication between services.
Prerequisites
The following tools are required to run this tutorial:
- Kind to run a local Kubernetes cluster with Docker container nodes.
- Kubernetes CLI (kubectl) to run commands against Kubernetes clusters.
- Helm CLI to install Odigos and the observability backend using helm charts.
Creating the Kubernetes cluster
Create a new local Kubernetes cluster, by running the following command:
kind create cluster
Installing Target Applications
Deploy the application using the following command:
kubectl apply -k github.com/keyval-dev/opentelemetry-go-instrumentation/docs/getting-started/emojivoto
Installing Jaeger
We will use Jaeger as our distributed tracing backend. Jaeger is a popular CNCF project that provides a complete distributed tracing solution.
Install Jaeger using the following command:
kubectl apply -f https://raw.githubusercontent.com/keyval-dev/opentelemetry-go-instrumentation/master/docs/getting-started/jaeger.yaml -n emojivoto
Installing Odigos
Odigos will be used for generating and sending traces to Jaeger. Install Odigos using the following command:
helm repo add odigos https://keyval-dev.github.io/odigos-charts/
helm install my-odigos odigos/odigos --namespace odigos-system --create-namespace
After all the pods in the odigos-system namespace are running, open the Odigos UI by running the following command:
kubectl port-forward svc/odigos-ui 3000:3000 -n odigos-system
And navigate to http://localhost:3000 to access the UI.
Selecting the target applications
There are two ways to select which applications Odigos should instrument:
- Opt out (recommended): Instrument everything, including every new application that will be deployed going forward. Users can still manually mark applications that should not be instrumented
- Opt In: Only instrument the applications selected manually by the user.
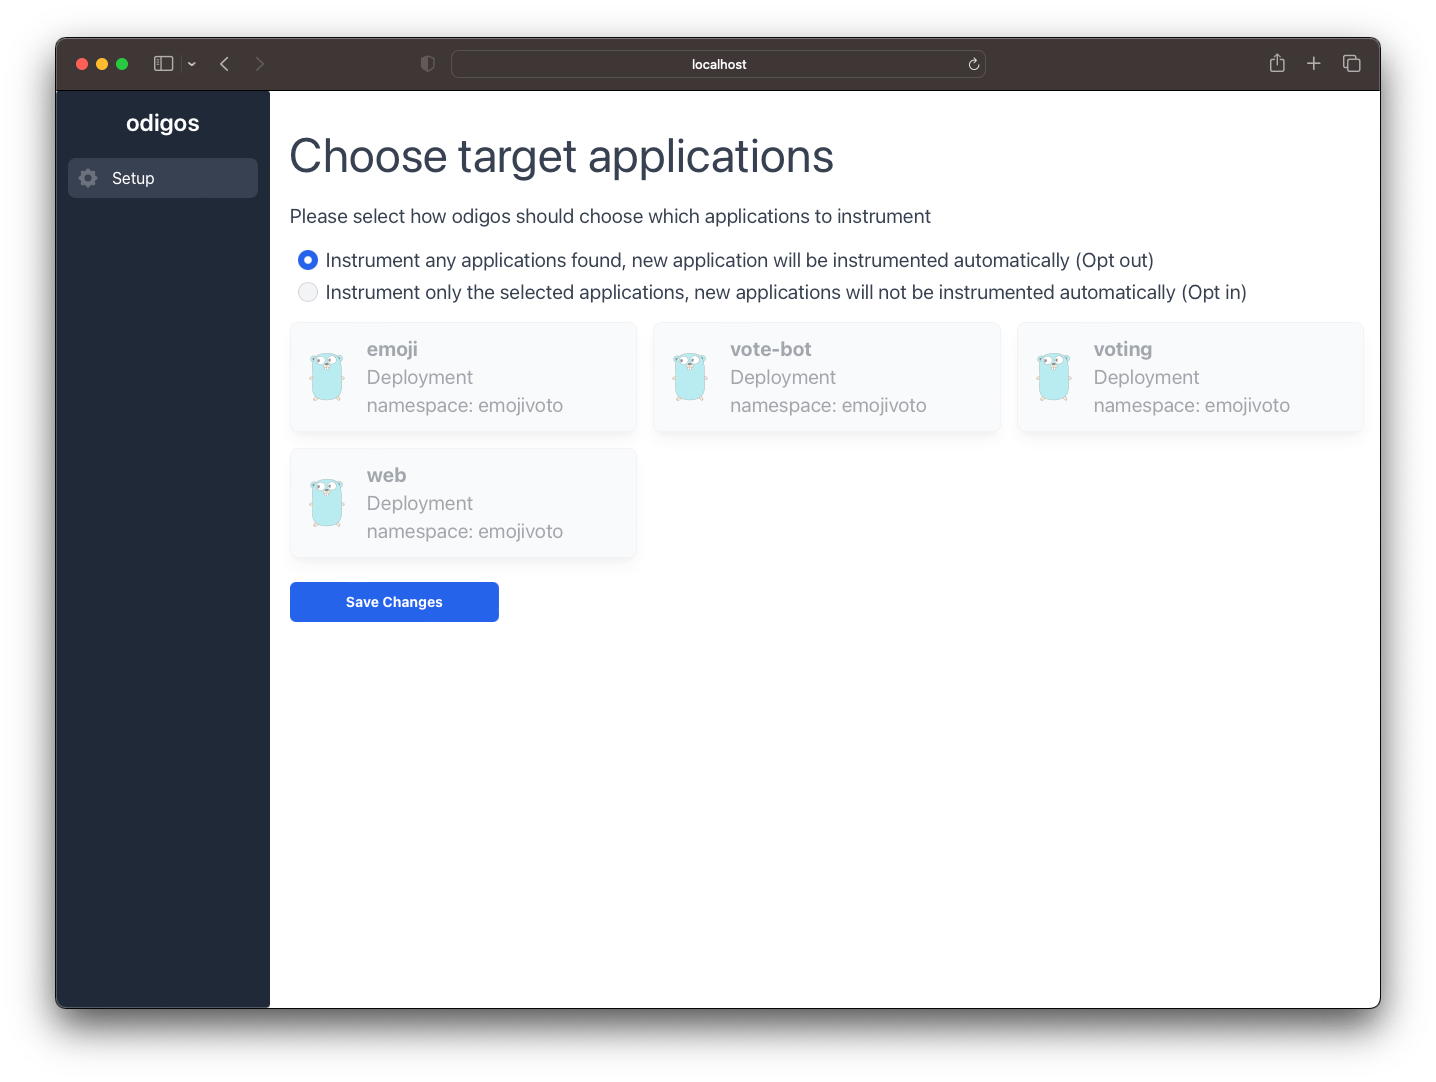
For this tutorial, we recommend choosing the opt out mode.
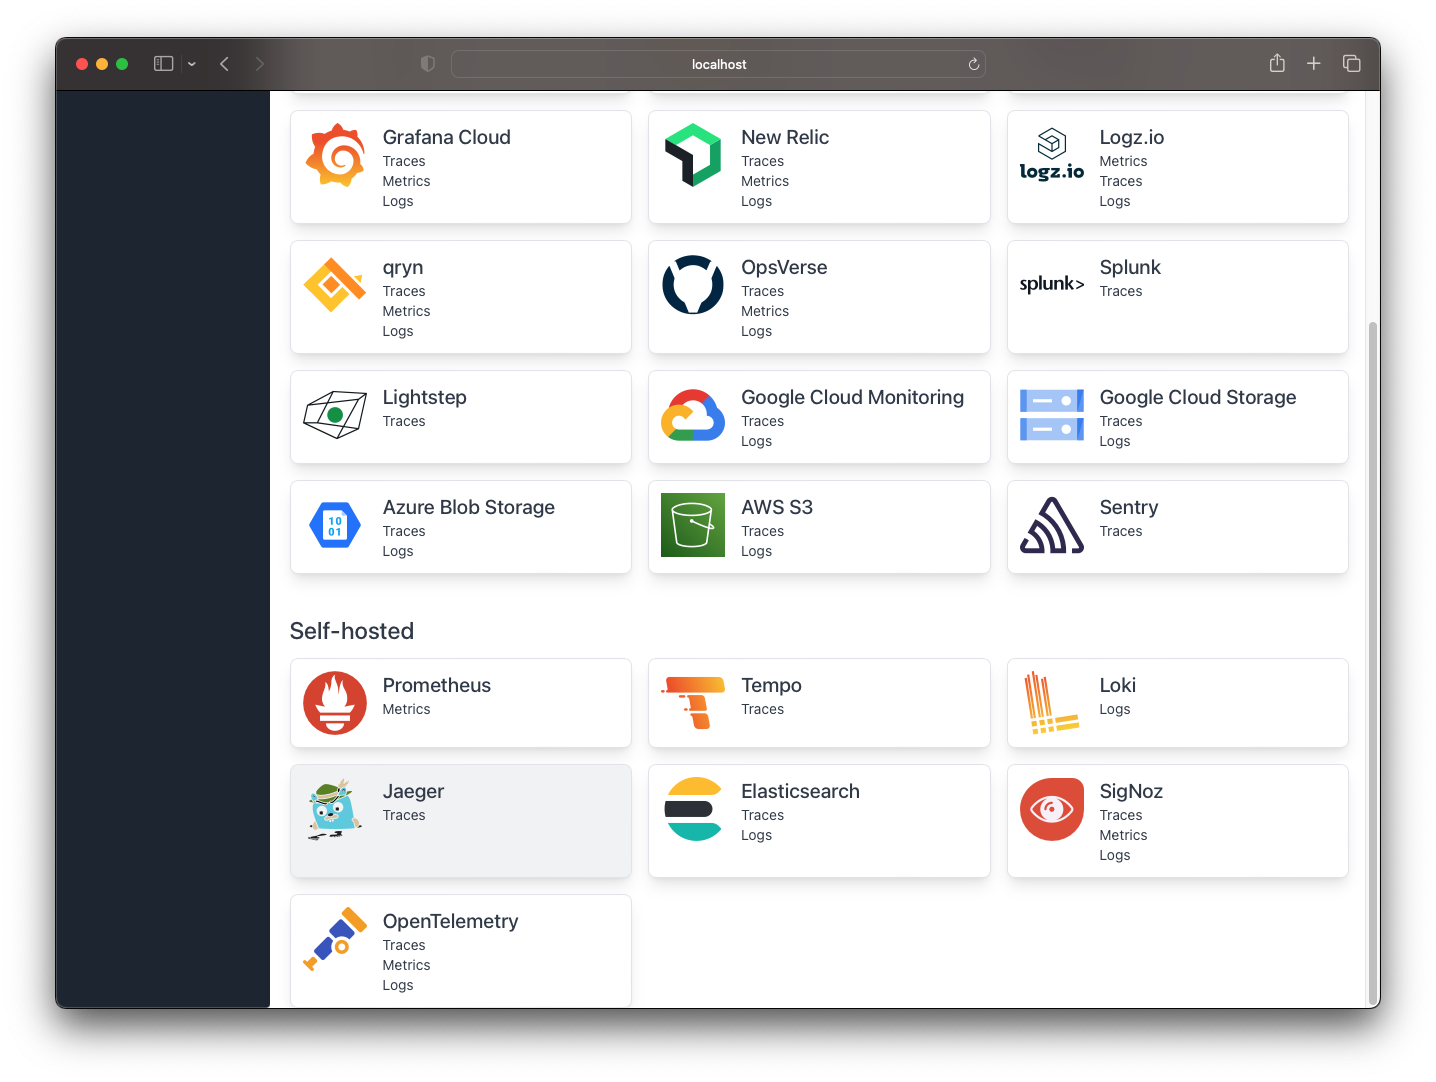
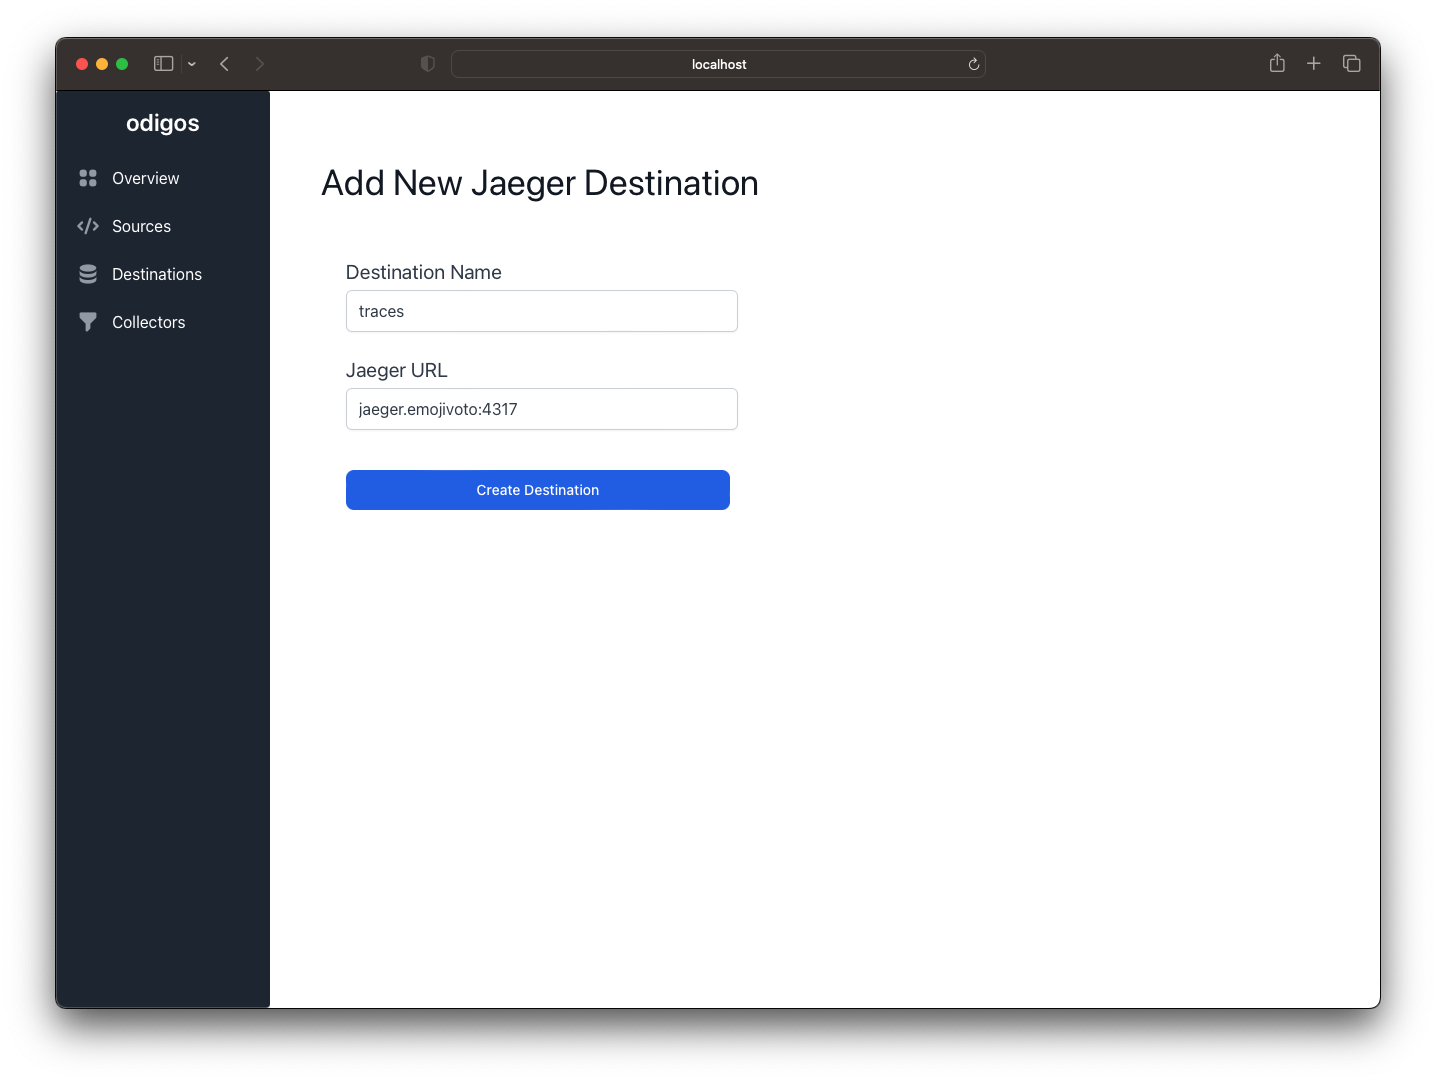
Adding Jaeger as a backend
To add Jaeger as a backend, scroll down to the Self-hosted section and click on Jaeger.
The last step is to provide the Jaeger endpoint. If you followed the steps in this tutorial, the endpoint will be jaeger.emojivoto:4317.
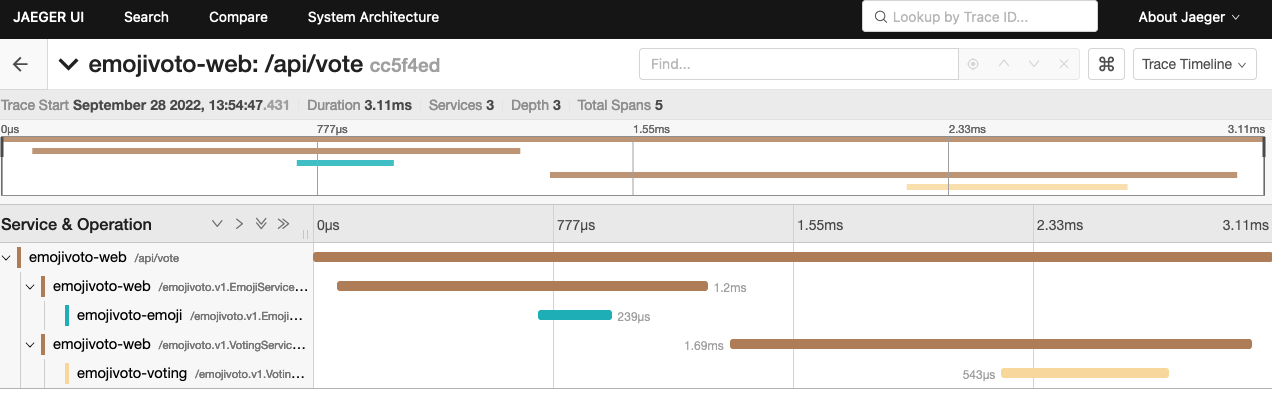
Viewing traces
Open the Jaeger UI by running the following command:
kubectl port-forward svc/jaeger 16686:16686 -n emojivoto
And navigate to http://localhost:16686 to access the UI.
Select one of the services from the list and click on Find Traces:
Summary
In this tutorial, we showed how to combine Odigos and Jaeger to make distributed tracing easy. At Keyval, we believe that adopting distributed tracing should be easy and accessible to everyone. We are working hard to make this a reality. If you have any questions or feedback, please reach out to us on Slack or GitHub.
https://github.com/keyval-dev/odigos
Related posts

Introduction to Log Pipelines
What are log pipelines, why we need them, what purpose do they server and how to design them?

Amir Blum
Oct 15 2023
Distributed Traces: Unlocking Performance with Organizational Effort
This article delves into the organizational effort required to unlock the full value of distributed traces in observability.
Eden Federman
Jul 31 2023
Faster and Better - Introducing the New Odigos Language Detector
Discover the latest enhancements in language detection within Odigos, including improved speed and efficiency.